Free Access
Fig. A.4.
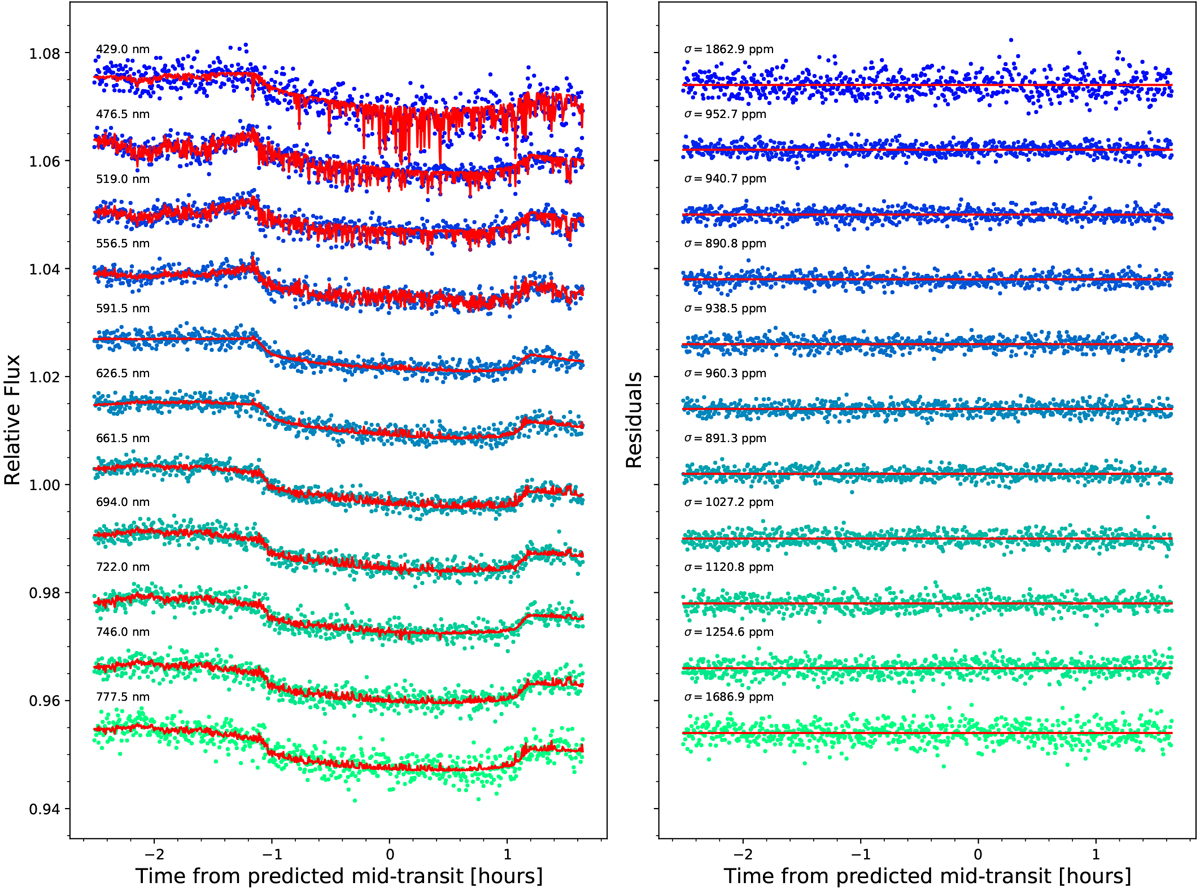
Spectroscopic light curves obtained using the custom passbands (see Fig. 3) for HAT-P-11b transit of September 25, 2017. Left panel: light curves after removing the common-mode systematics and best fit model (red line). Right panel: residuals of the light curves after removing a transit model and systematic effects.
Current usage metrics show cumulative count of Article Views (full-text article views including HTML views, PDF and ePub downloads, according to the available data) and Abstracts Views on Vision4Press platform.
Data correspond to usage on the plateform after 2015. The current usage metrics is available 48-96 hours after online publication and is updated daily on week days.
Initial download of the metrics may take a while.