Fig. A.1.
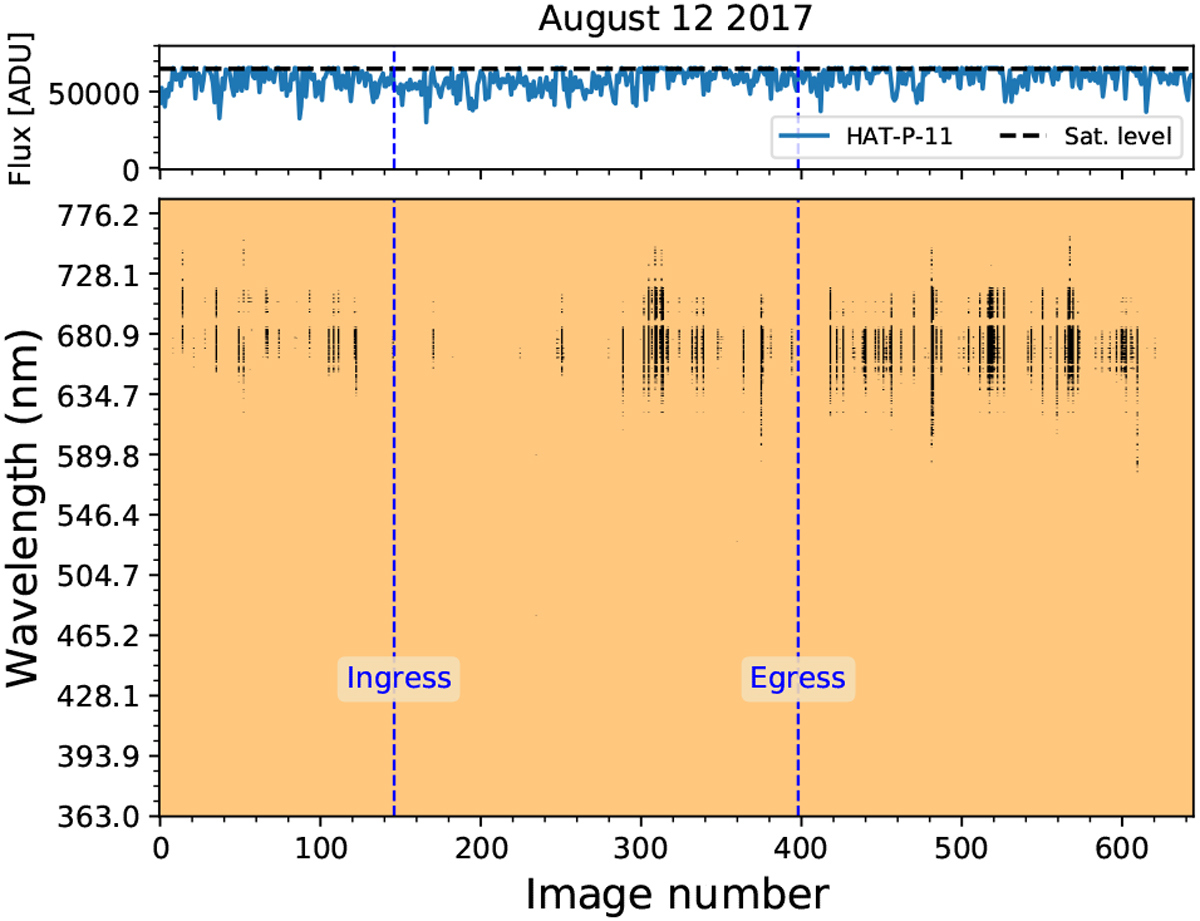
HAT-P-11 count level of the pixel with the maximum flux inside the extraction aperture (top panel) and saturated pixels of the time series (bottom panel) for the night of August 12, 2017. In the bottom panel the saturated pixels are shown in black while the orange pixels are below the saturation level. The flux of the contaminant star was extracted using the pre-transit nonsaturated images.
Current usage metrics show cumulative count of Article Views (full-text article views including HTML views, PDF and ePub downloads, according to the available data) and Abstracts Views on Vision4Press platform.
Data correspond to usage on the plateform after 2015. The current usage metrics is available 48-96 hours after online publication and is updated daily on week days.
Initial download of the metrics may take a while.