Fig. 9.
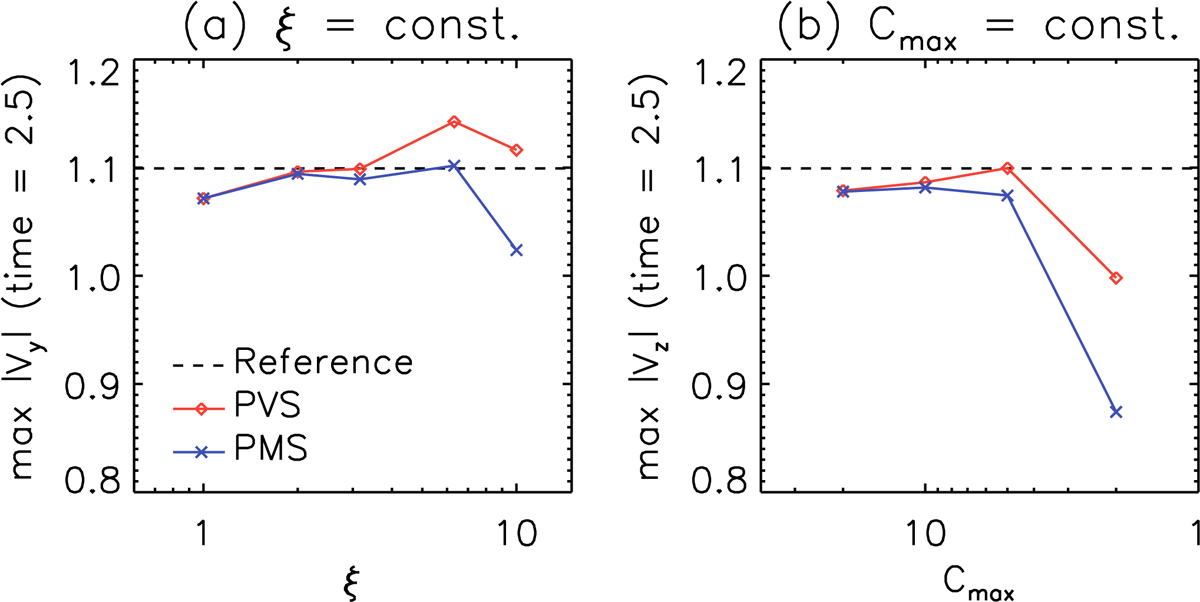
Dependence of the Rayleigh-Taylor instability on the speed of sound reduction rate with ξ = const. (panel a) and Cmax = const (panel b). Each panel shows the maximum amplitude of the y-component of the velocity at time = 2.5 with PVS form (red with diamond) and PMS form (blue with cross). The horizontal dashed line shows the reference simulation results without the RSST (ξ = 1) in 4096 × 4096 grids.
Current usage metrics show cumulative count of Article Views (full-text article views including HTML views, PDF and ePub downloads, according to the available data) and Abstracts Views on Vision4Press platform.
Data correspond to usage on the plateform after 2015. The current usage metrics is available 48-96 hours after online publication and is updated daily on week days.
Initial download of the metrics may take a while.