Fig. 4.
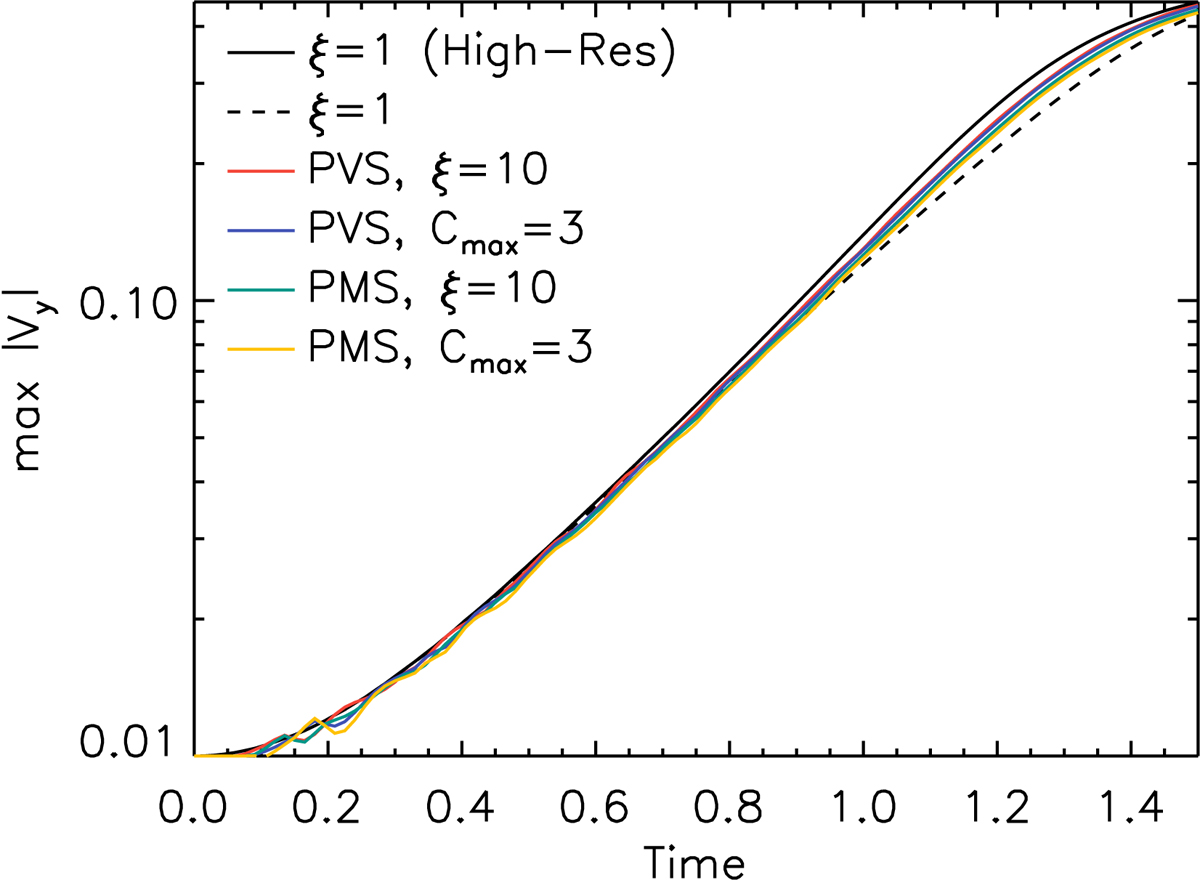
Time evolution of the Kelvin-Helmholtz instability with density contrast of 2. The figure shows the maximum amplitude of the y-component of the velocity without RSST (ξ = 1) in 4096 × 4096 grids (black solid), without RSST (ξ = 1) in the default 1024 × 1024 grids (black dashed), with PVS form (ξ = 10, red), with PVS form (Cmax = 3, blue), with PMS form (ξ = 10, green), and with PMS form (Cmax = 3, yellow).
Current usage metrics show cumulative count of Article Views (full-text article views including HTML views, PDF and ePub downloads, according to the available data) and Abstracts Views on Vision4Press platform.
Data correspond to usage on the plateform after 2015. The current usage metrics is available 48-96 hours after online publication and is updated daily on week days.
Initial download of the metrics may take a while.