Fig. 1.
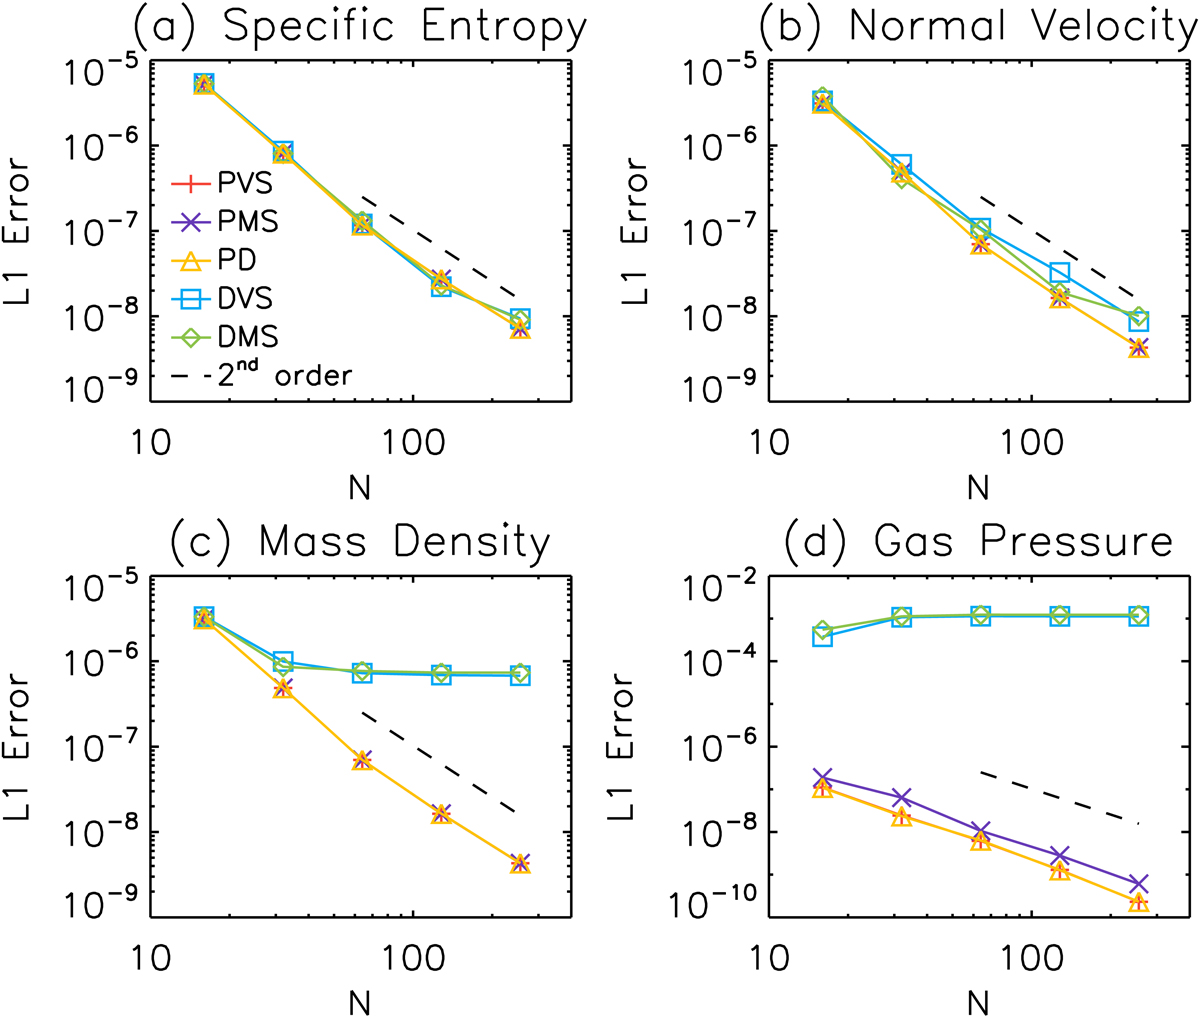
Convergence test of linear entropy wave. The horizontal axis N represents the number of grid points used in the x-direction. Shown are the L1 errors of the specific entropy (panel a), velocity component normal to the propagation direction of wave V⊥ (panel b), mass density (panel c), and gas pressure (panel d). Each line corresponds to the form of RSST used in the simulation. The dashed line in each panel shows the analytical line of second-order convergence. Details of the test problem are given in Sect. 4.4.
Current usage metrics show cumulative count of Article Views (full-text article views including HTML views, PDF and ePub downloads, according to the available data) and Abstracts Views on Vision4Press platform.
Data correspond to usage on the plateform after 2015. The current usage metrics is available 48-96 hours after online publication and is updated daily on week days.
Initial download of the metrics may take a while.