Fig. 1.
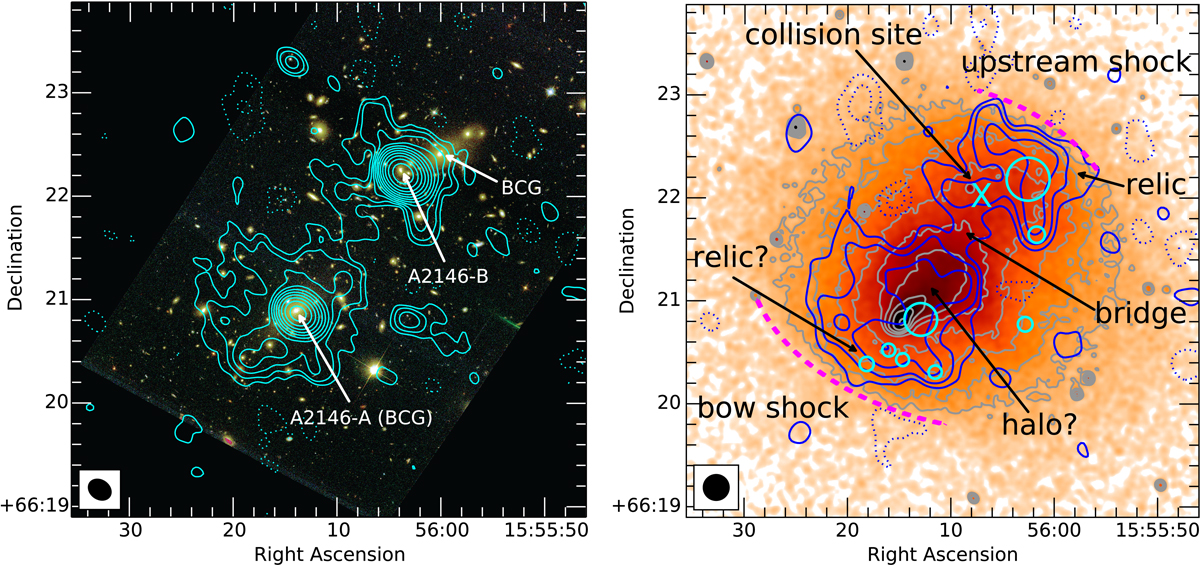
HST composite optical (left) and Chandra (right) images overlaid with the LOFAR 144 MHz contours (blue in the right panel). The resolutions of the LOFAR contours shown in the bottom left corner are 14″ × 11″ (PA = 55°, left) and 15″ × 15″ (right). In the right panel, the compact radio sources indicated with cyan circles are subtracted in the uv data. The magenta dashed lines show the shock locations. In both images, the LOFAR contours start from ±2.5σ (dotted negative), where σ = 135 and 160 μJy beam−1 in the left and right panels, respectively. The Chandra first contour is 2 × 10⁻⁹ cts cm−2 s−1 arcsec−2. The next contours are spaced by a factor of ![]() .
.
Current usage metrics show cumulative count of Article Views (full-text article views including HTML views, PDF and ePub downloads, according to the available data) and Abstracts Views on Vision4Press platform.
Data correspond to usage on the plateform after 2015. The current usage metrics is available 48-96 hours after online publication and is updated daily on week days.
Initial download of the metrics may take a while.