Fig. 8.
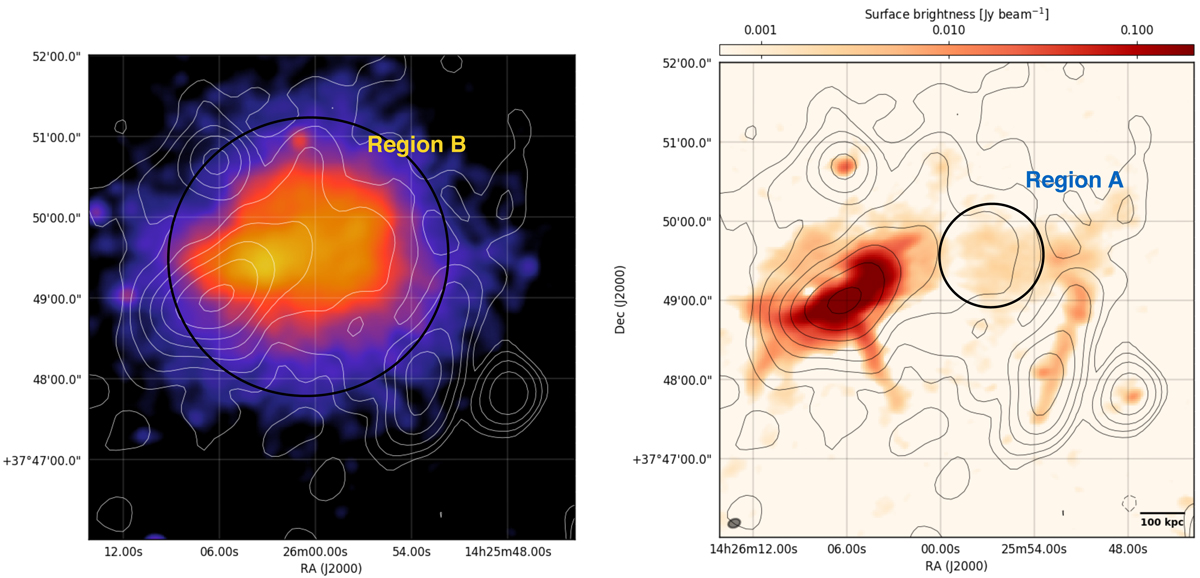
Left panel: low-resolution, 30″ × 30″ VLA 1.4 GHz image contours overlaid on the Chandra image. The VLA contours (white) show the (1, 2, 4, …)×3 × σVLA, where σVLA = 55 μJy beam−1. Region B was used to extrapolate the radio halo flux (see Sect. 3.3). Right panel: same low-resolution VLA image contours (in black) overlaid on the LOFAR 150 MHz extended emission subtracted image. Region A shows the portion where the radio halo emission is not contaminated by the RP and HT.
Current usage metrics show cumulative count of Article Views (full-text article views including HTML views, PDF and ePub downloads, according to the available data) and Abstracts Views on Vision4Press platform.
Data correspond to usage on the plateform after 2015. The current usage metrics is available 48-96 hours after online publication and is updated daily on week days.
Initial download of the metrics may take a while.