Fig. 5.
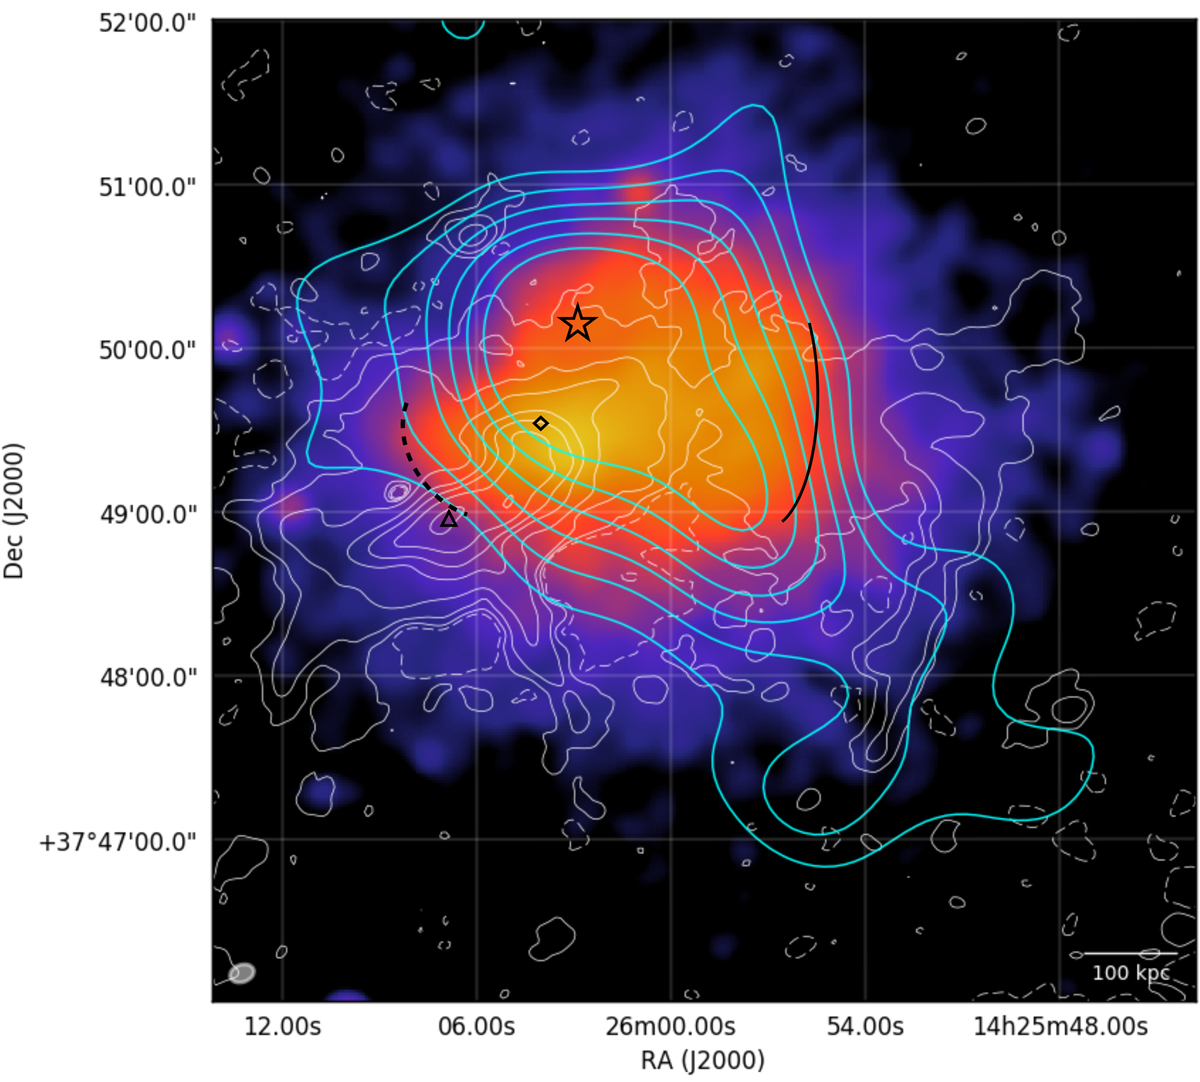
Full-resolution (9″ × 6″) LOFAR image overlaid on an exposure-corrected, background-subtracted Chandra image in the 0.5–2.0 keV energy band with a total integration time of 22.9 ks. The LOFAR contours (white) show the (1, 2, 4, …)×5 × σLOFAR levels and the dashed white contours show the −3σLOFAR, where σLOFAR = 150 μJy beam−1. The cyan contours are the weak lensing measurements showing the dark matter distribution. The star, square, and triangle show the peak of the dark matter distribution, X-ray peak, and radio peak, respectively. The solid black and dashed black line show the tentative location of the shock and cold front suggested by Botteon et al. (2018a).
Current usage metrics show cumulative count of Article Views (full-text article views including HTML views, PDF and ePub downloads, according to the available data) and Abstracts Views on Vision4Press platform.
Data correspond to usage on the plateform after 2015. The current usage metrics is available 48-96 hours after online publication and is updated daily on week days.
Initial download of the metrics may take a while.