Free Access
Fig. 4.
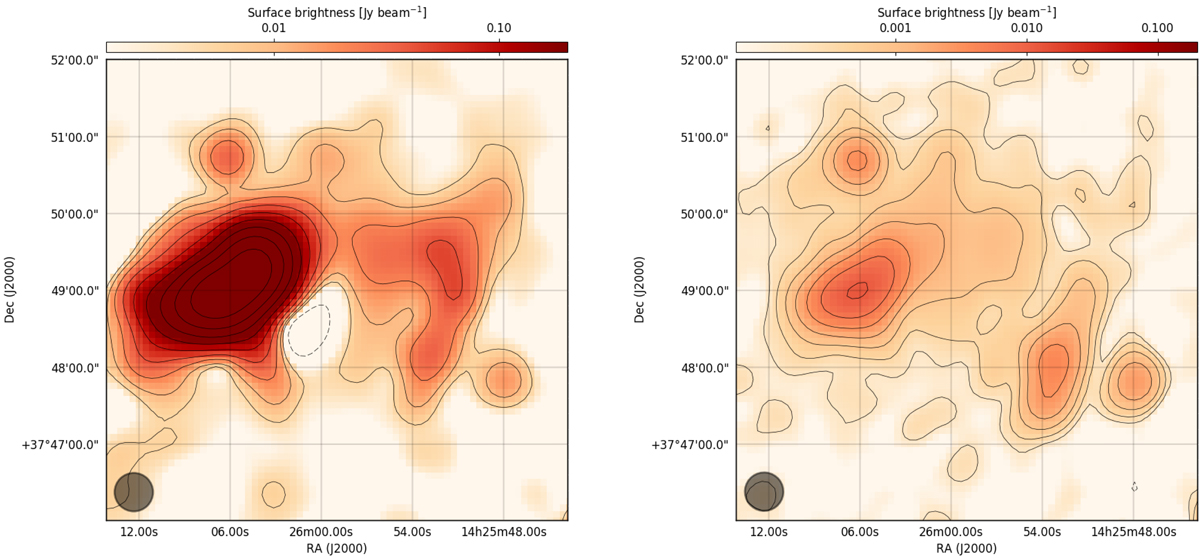
Left panel: 150 MHz LOFAR image (30″ × ″30) in which the contours show the (1, 2, 4, …)×3 × σLOFAR, 150 levels, where σLOFAR, 150 = 1.8 mJy beam−1. Right panel: 1.4 GHz VLA image (26″ × 14″) where the contours show the (1, 2, 4, …)×3 × σVLA, 1400 levels, where σVLA, 1400 = 40 μJy beam−1.
Current usage metrics show cumulative count of Article Views (full-text article views including HTML views, PDF and ePub downloads, according to the available data) and Abstracts Views on Vision4Press platform.
Data correspond to usage on the plateform after 2015. The current usage metrics is available 48-96 hours after online publication and is updated daily on week days.
Initial download of the metrics may take a while.