Fig. 2.
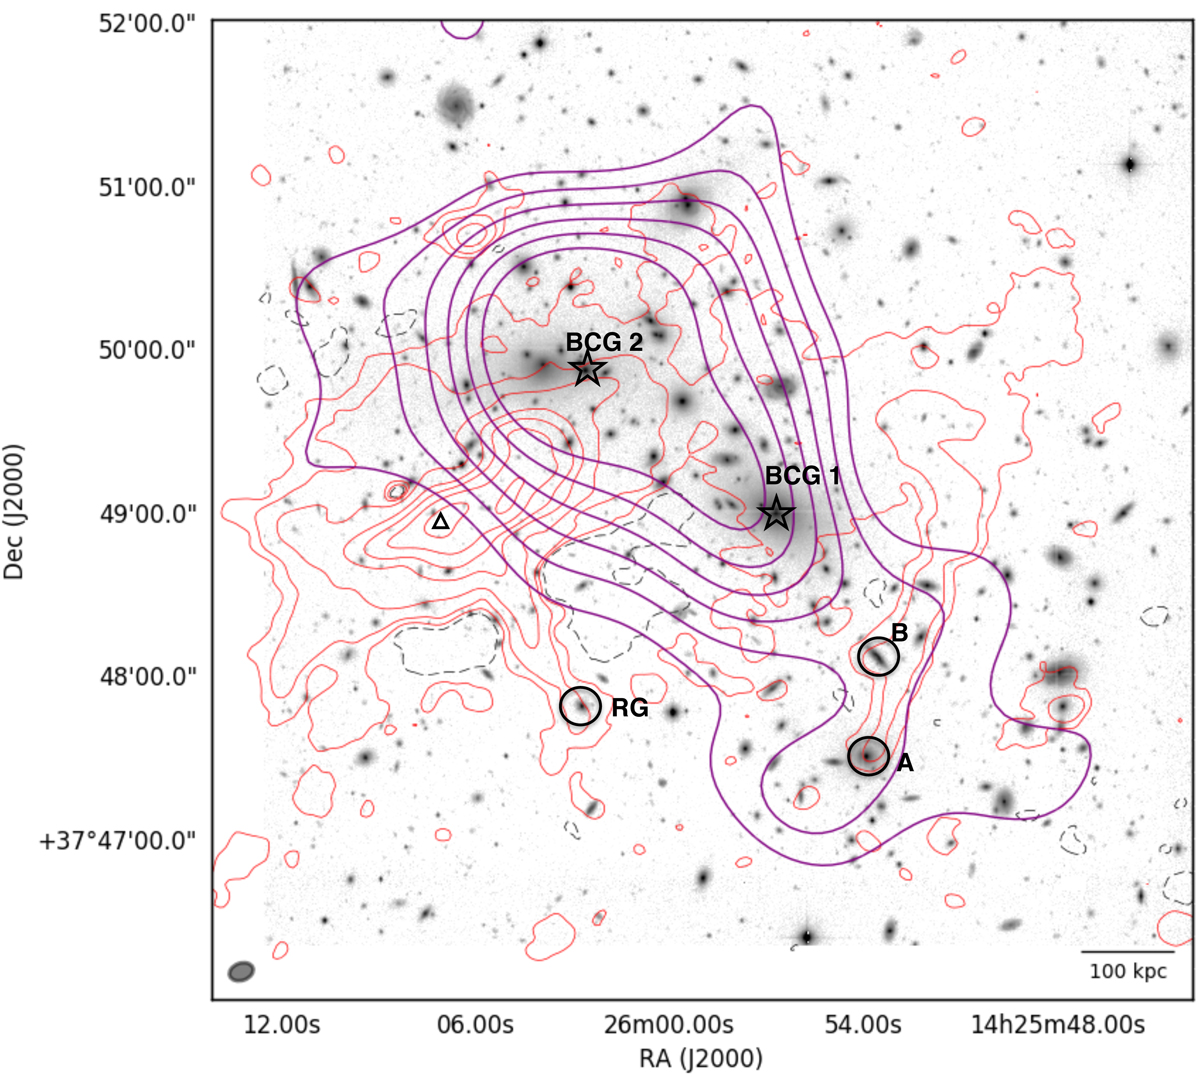
Full-resolution (9″ × 6″) LOFAR image overlaid on a CFHT r-band image. The LOFAR contours (solid red) show the (1, 2, 4, …) × 3 × σLOFAR levels and the dashed red contours show the −3σLOFAR contour where σLOFAR = 150 μJy beam−1. The purple contours represent the weak lensing measurement (CFHT data: Sect. 2.5) showing the dark matter distribution. The two stars indicate the position of the two brightest cluster galaxies (BCG) in the cluster. The triangle indicates the position of the peak radio emission. The circle A indicates the location of the galaxy that is the optical counterpart of source HT. Circle B indicates a radio-loud galaxy that is not associated with source HT. Circle RG indicates the location of the galaxy that could be a possible counterpart of RP (discussed in Sect. 4).
Current usage metrics show cumulative count of Article Views (full-text article views including HTML views, PDF and ePub downloads, according to the available data) and Abstracts Views on Vision4Press platform.
Data correspond to usage on the plateform after 2015. The current usage metrics is available 48-96 hours after online publication and is updated daily on week days.
Initial download of the metrics may take a while.