Fig. 5.
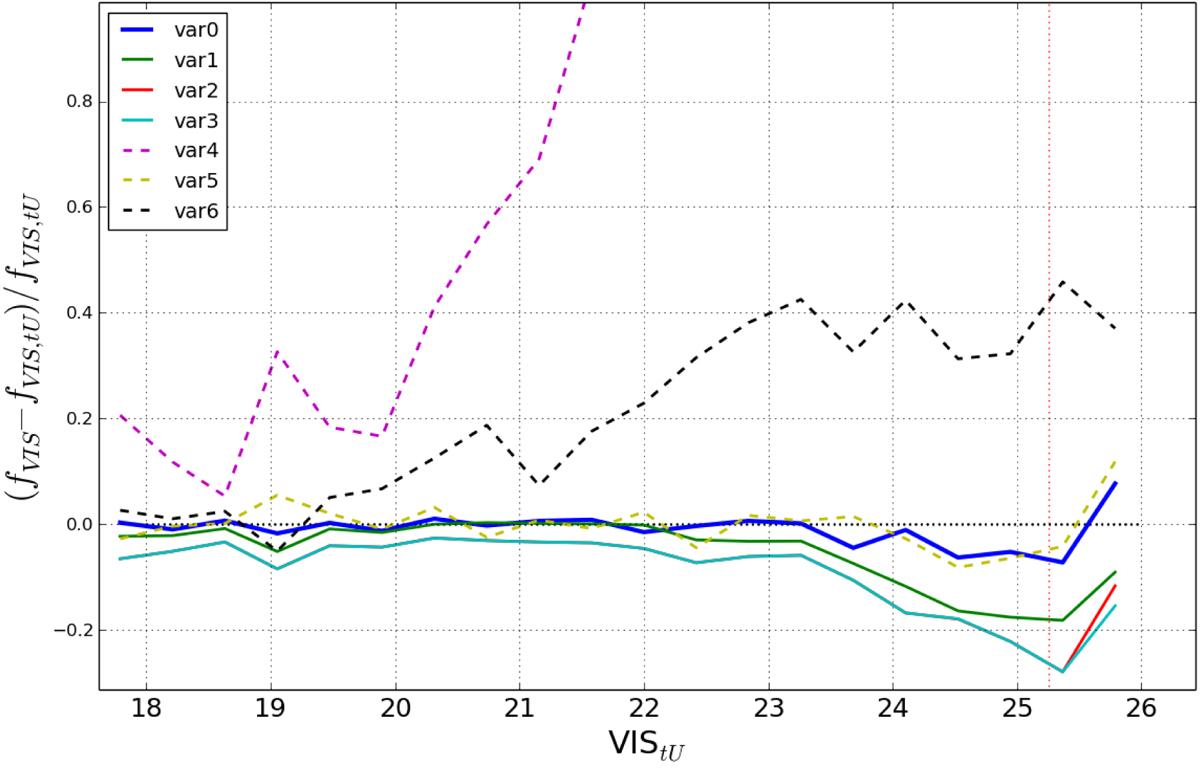
Compared accuracy of A-PHOT on a simulated Euclid VIS-like image using the different input parameters listed in Table 2. The plots show the relative difference between the measured and the input flux as a function of input magnitude. Solid lines correspond to runs on the normal simulated image, whereas dashed lines refer to runs in which an artificial constant background has been added to the image. See text for details.
Current usage metrics show cumulative count of Article Views (full-text article views including HTML views, PDF and ePub downloads, according to the available data) and Abstracts Views on Vision4Press platform.
Data correspond to usage on the plateform after 2015. The current usage metrics is available 48-96 hours after online publication and is updated daily on week days.
Initial download of the metrics may take a while.