Fig. 4.
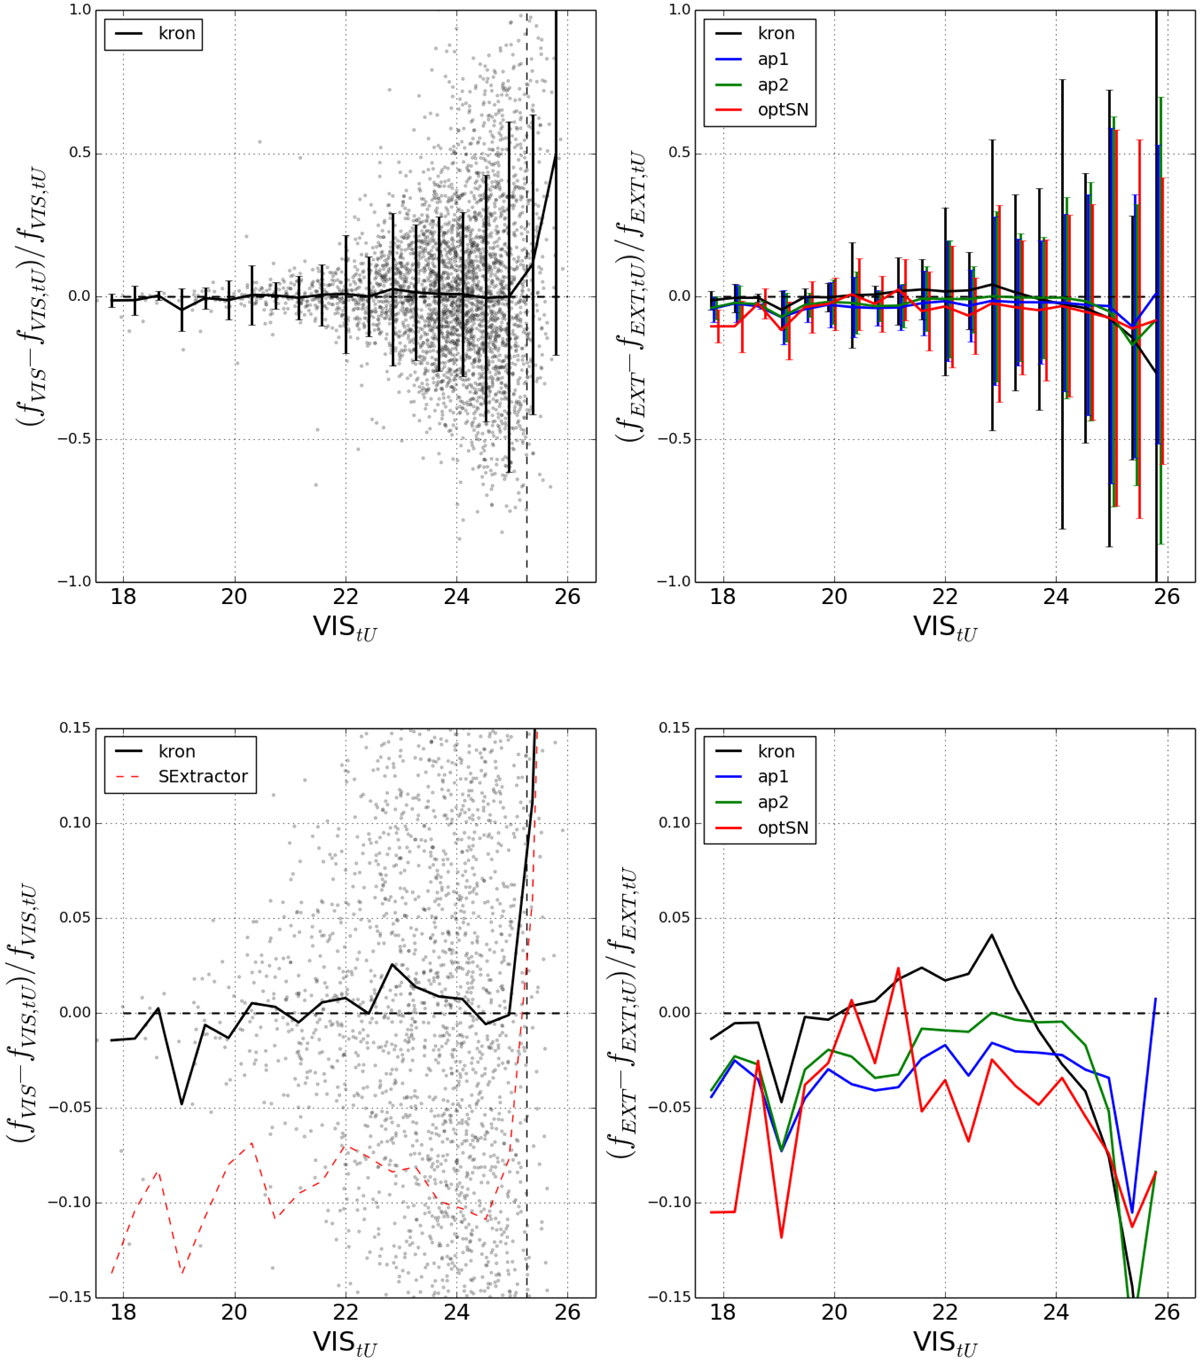
Accuracy in flux determination on simulated datasets. Upper panels: full dataset. Lower panels: zoom in the central strips. Left panels: HRI flux determination. Right panels: LRI flux determinations, using different methods. All plots show the quantity (fmeas − finput)/finput versus input HRI magnitude: the median offset is consistent with zero in the HRI case, and typically below 5% in the LRI cases. The red dashed line in the bottom left panel refers to a SEXTRACTOR run. See text for details.
Current usage metrics show cumulative count of Article Views (full-text article views including HTML views, PDF and ePub downloads, according to the available data) and Abstracts Views on Vision4Press platform.
Data correspond to usage on the plateform after 2015. The current usage metrics is available 48-96 hours after online publication and is updated daily on week days.
Initial download of the metrics may take a while.