Fig. 3.
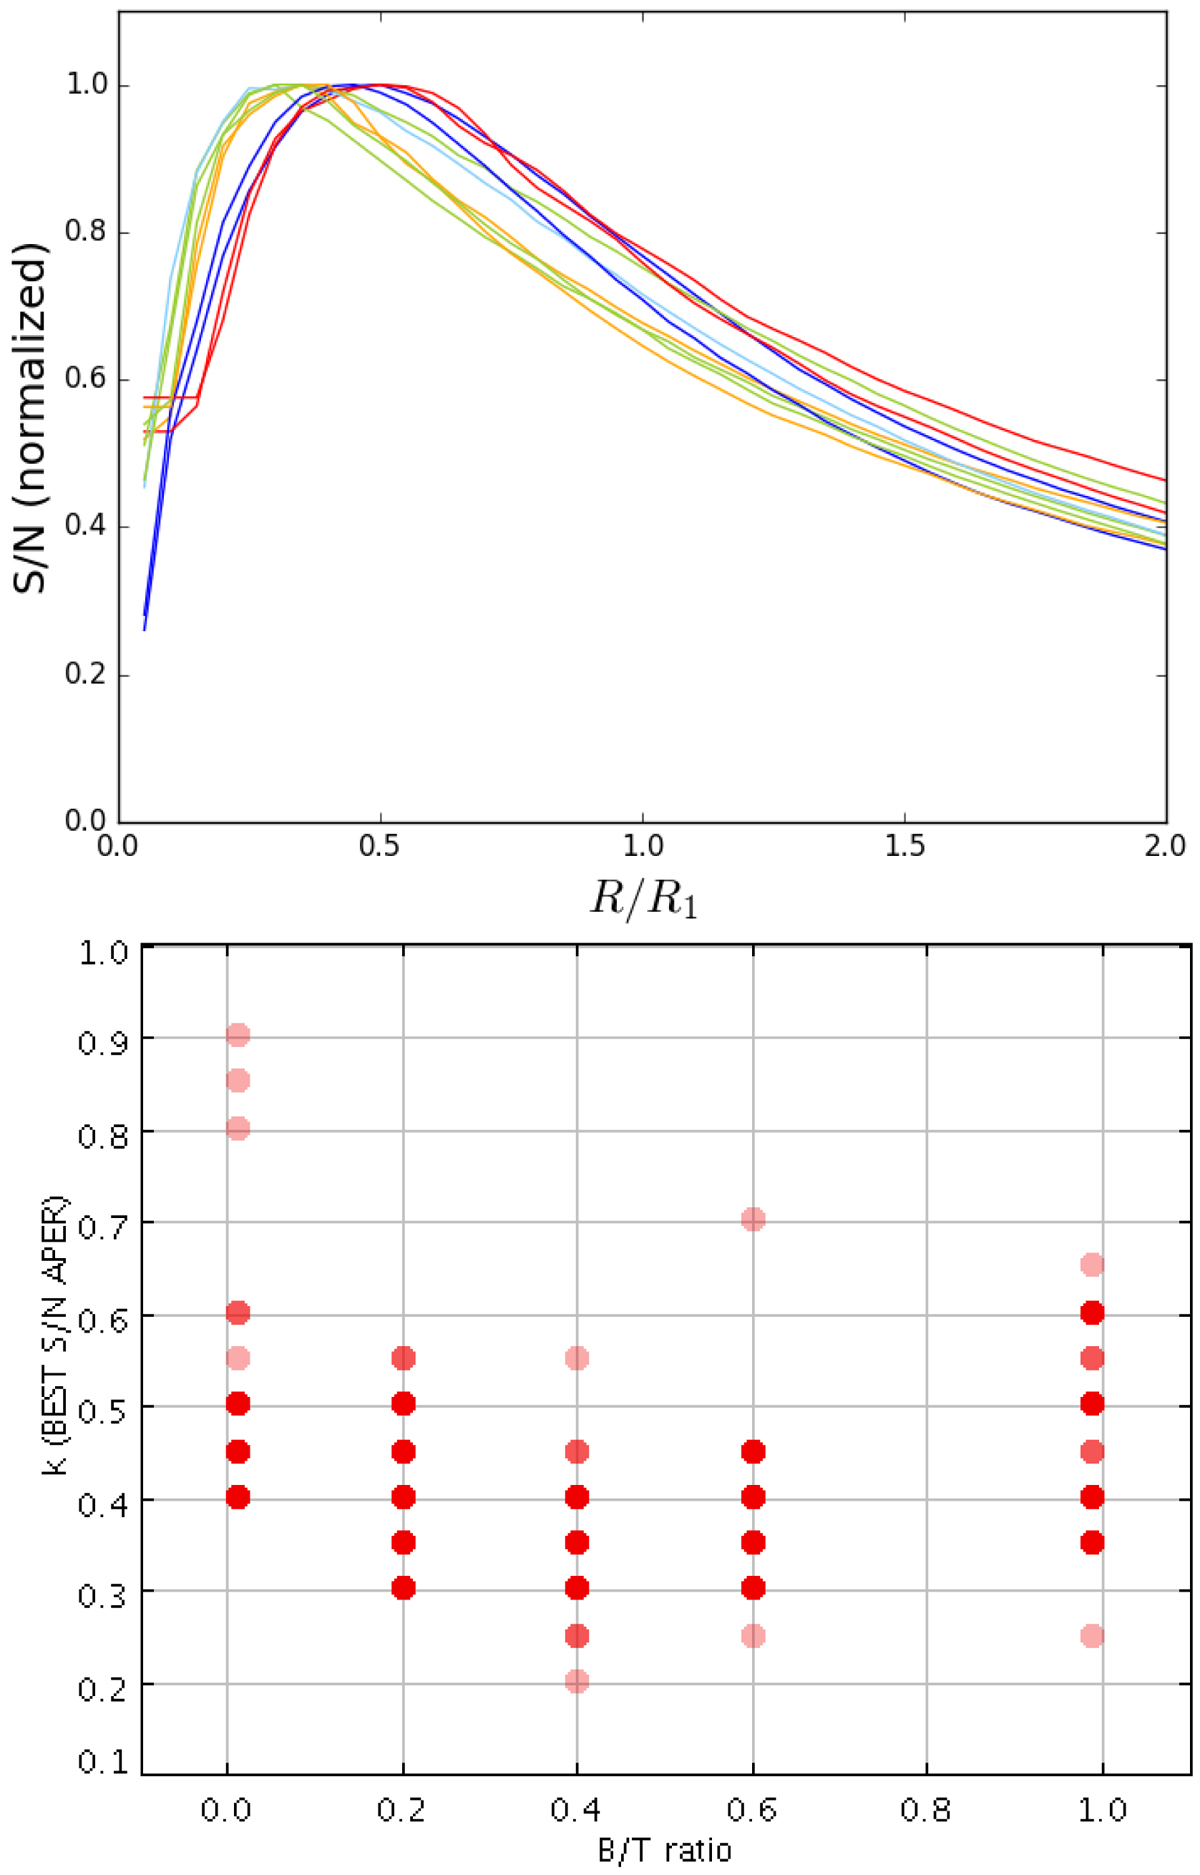
Top panel: typical trends of S/N values within apertures with major semi-axis R, as a function of the normalized ![]() , for a subset of simulated double-Sersic galaxies. The curves are color-coded to show the morphological type of the synthetic galaxies, with red representing bulge-dominated objects, blue representing disks, and yellow-green representing double components objects with different bulge-to-total ratios. Bottom panel: values of the best S/N aperture dimensions as a function of the bulge-to-total ratio.
, for a subset of simulated double-Sersic galaxies. The curves are color-coded to show the morphological type of the synthetic galaxies, with red representing bulge-dominated objects, blue representing disks, and yellow-green representing double components objects with different bulge-to-total ratios. Bottom panel: values of the best S/N aperture dimensions as a function of the bulge-to-total ratio.
Current usage metrics show cumulative count of Article Views (full-text article views including HTML views, PDF and ePub downloads, according to the available data) and Abstracts Views on Vision4Press platform.
Data correspond to usage on the plateform after 2015. The current usage metrics is available 48-96 hours after online publication and is updated daily on week days.
Initial download of the metrics may take a while.