Fig. 2.
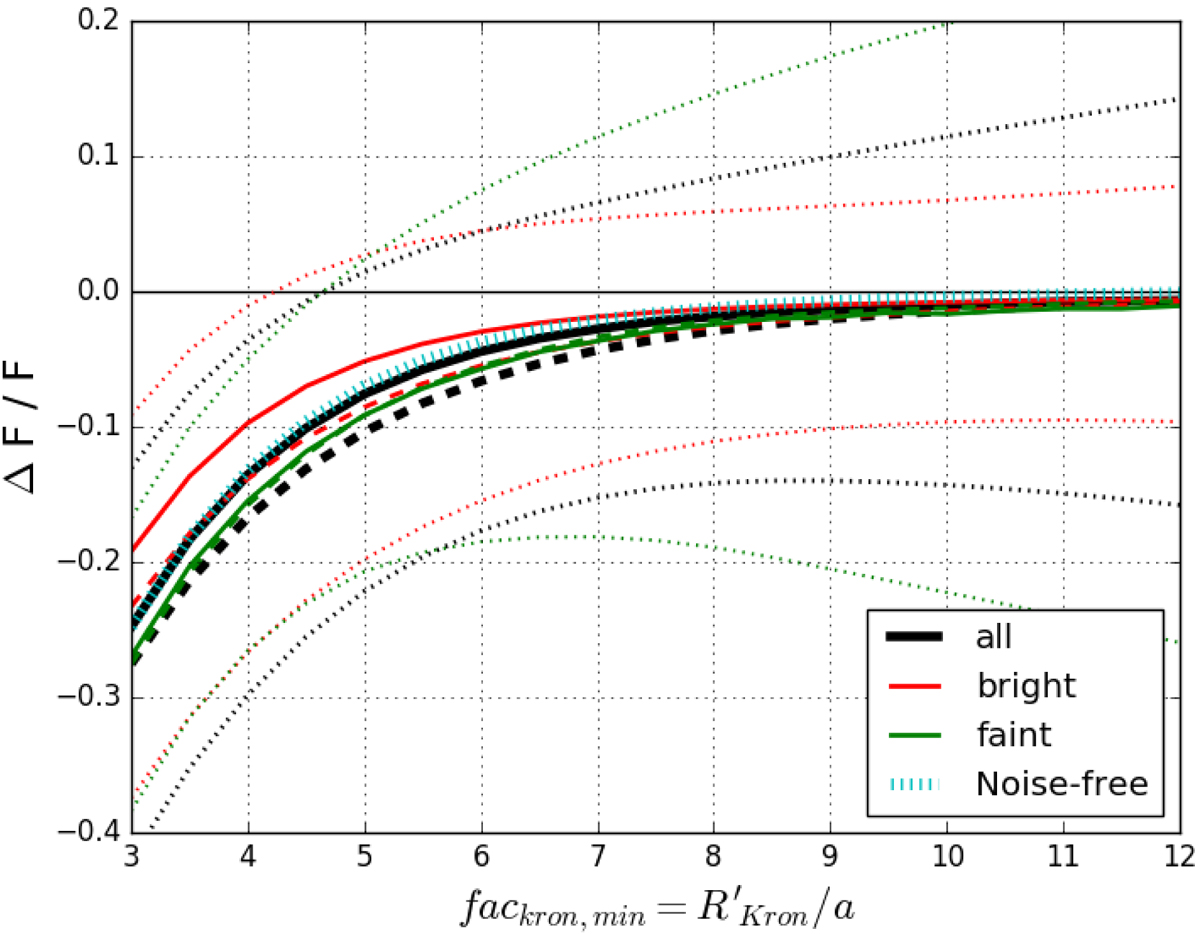
Lost fractions ΔF/F of the total true flux of ∼12 000 simulated galactic objects. The fluxes have been measured within elliptical apertures whose major semi-axis is equal to a given multiple fackron, min of the object isophotal semi-axis a. The solid lines show the median, the dashed lines the mean, and the dotted lines the standard deviations. The black line represents all sources, the red line only the bright (m < 24.5) sources, and the green line only the faint (25.5 < m < 26.5) sources. The dotted cyan curve corresponds to a full run on images where the observational noise was not included. Imposing ![]() , as typically done, yields a substantial underestimation of the flux. See text for more details.
, as typically done, yields a substantial underestimation of the flux. See text for more details.
Current usage metrics show cumulative count of Article Views (full-text article views including HTML views, PDF and ePub downloads, according to the available data) and Abstracts Views on Vision4Press platform.
Data correspond to usage on the plateform after 2015. The current usage metrics is available 48-96 hours after online publication and is updated daily on week days.
Initial download of the metrics may take a while.