Fig. 9.
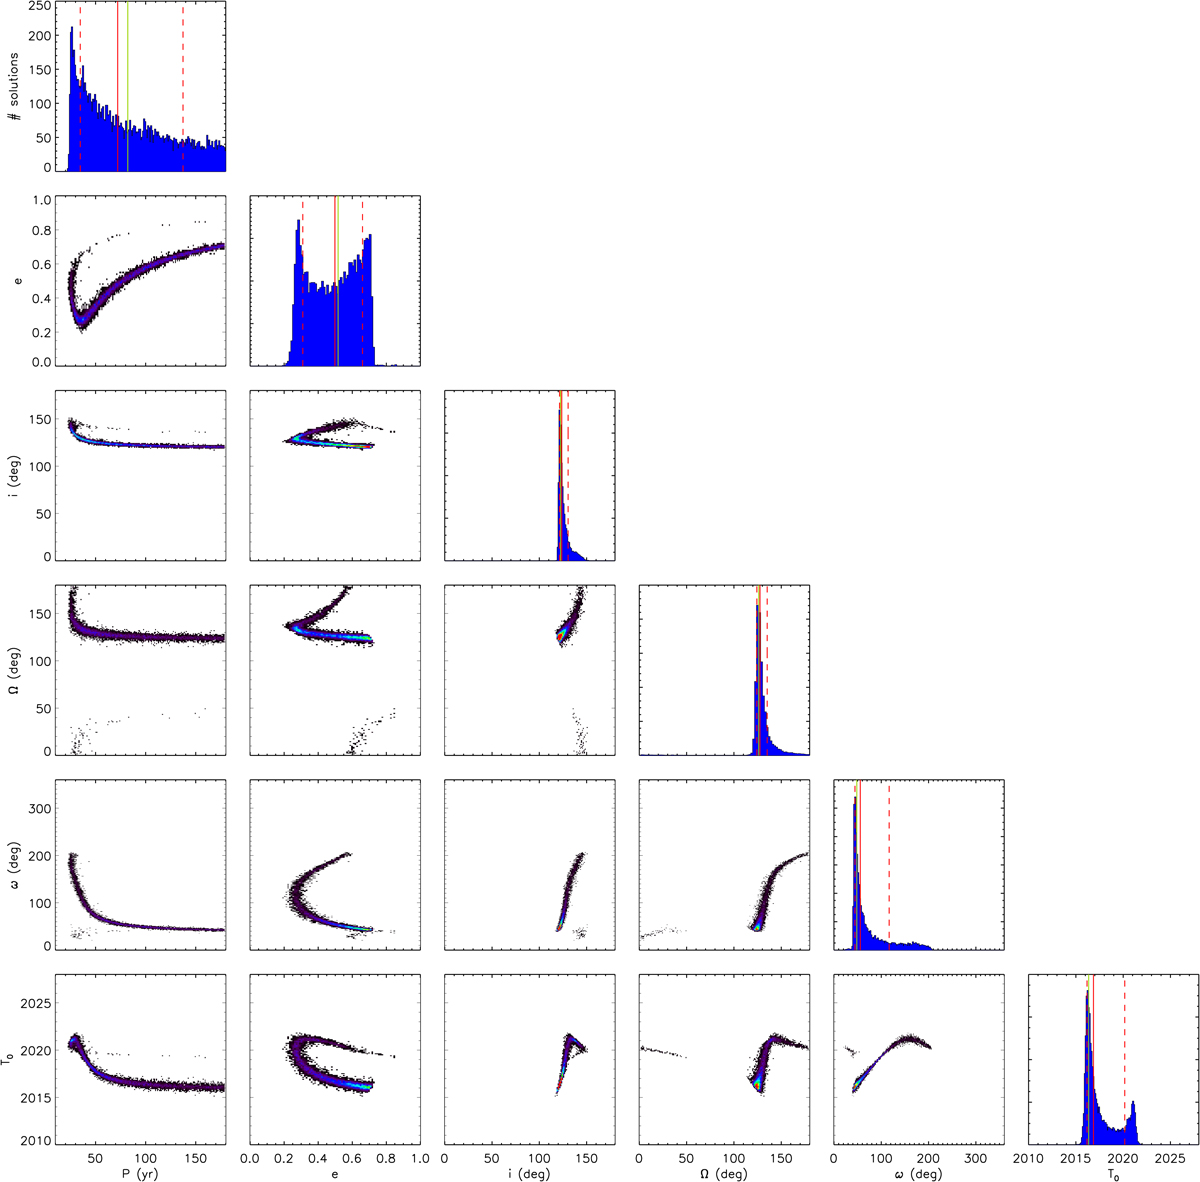
LSMC distributions of the six Campbell orbital elements for all the fitted solutions with ![]() among 2 000 000 random trials. The diagonal diagrams represent the 1D histogram distributions of the individual elements. The off-diagonal diagrams show the correlations between pairs of orbital elements. The linear color scale in the correlation plots accounts for the relative local density of the orbital solutions. In the diagonal histograms, the red solid line represents the 50 percentile values, the red dashed lines show the intervals at 68%, and the green solid line indicates the best χ2 fitted solution.
among 2 000 000 random trials. The diagonal diagrams represent the 1D histogram distributions of the individual elements. The off-diagonal diagrams show the correlations between pairs of orbital elements. The linear color scale in the correlation plots accounts for the relative local density of the orbital solutions. In the diagonal histograms, the red solid line represents the 50 percentile values, the red dashed lines show the intervals at 68%, and the green solid line indicates the best χ2 fitted solution.
Current usage metrics show cumulative count of Article Views (full-text article views including HTML views, PDF and ePub downloads, according to the available data) and Abstracts Views on Vision4Press platform.
Data correspond to usage on the plateform after 2015. The current usage metrics is available 48-96 hours after online publication and is updated daily on week days.
Initial download of the metrics may take a while.