Fig. 8.
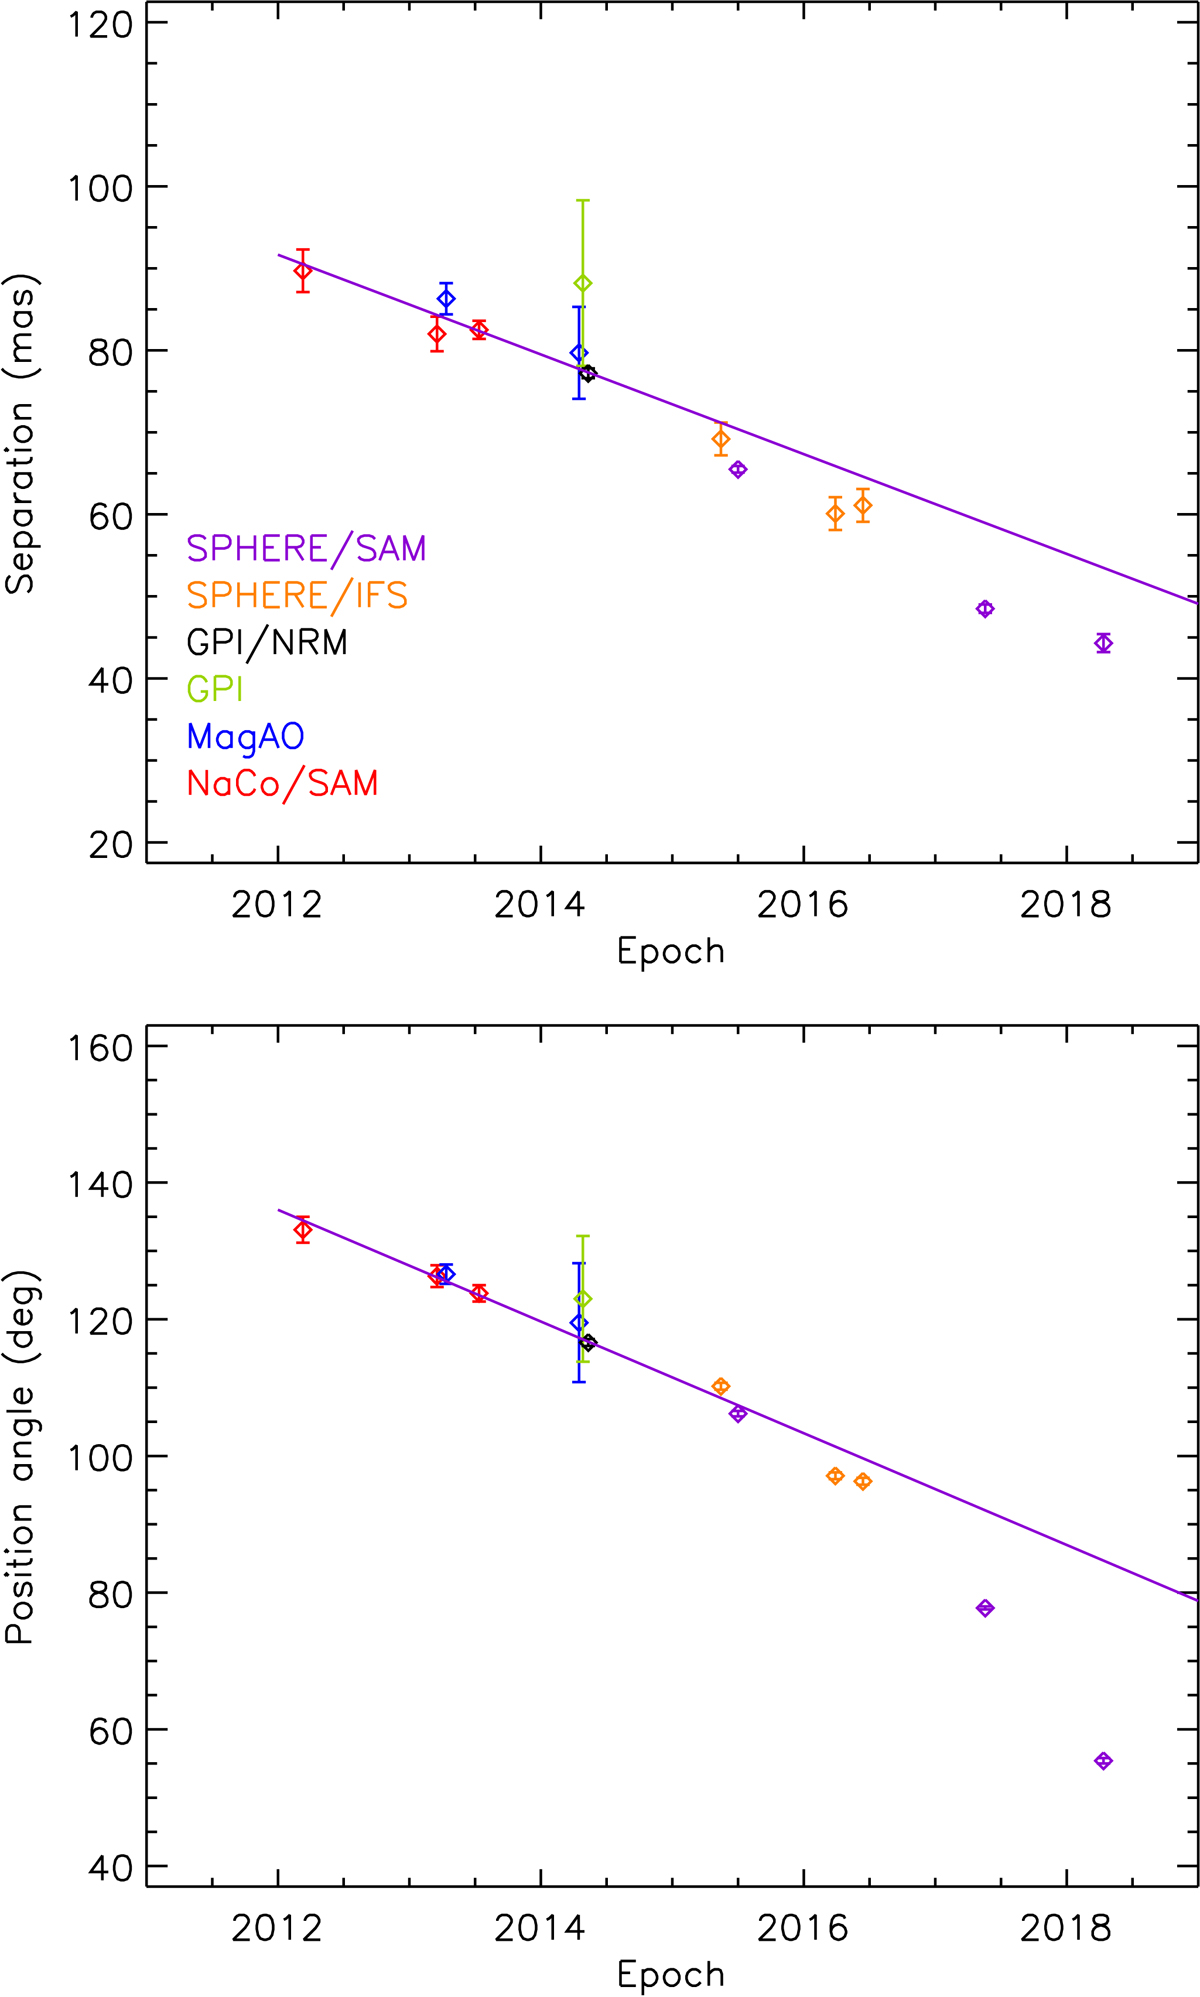
Temporal evolution of the separation (top panel) and position angle (bottom panel) of HD 142527B. For both panels, a linear fit to the data points obtained before 2015 is shown (purple solid line) to show the progressive deviation from linearity of the SPHERE measurements. The GPI measurements (green data points) are not considered for the fits.
Current usage metrics show cumulative count of Article Views (full-text article views including HTML views, PDF and ePub downloads, according to the available data) and Abstracts Views on Vision4Press platform.
Data correspond to usage on the plateform after 2015. The current usage metrics is available 48-96 hours after online publication and is updated daily on week days.
Initial download of the metrics may take a while.