Fig. 2.
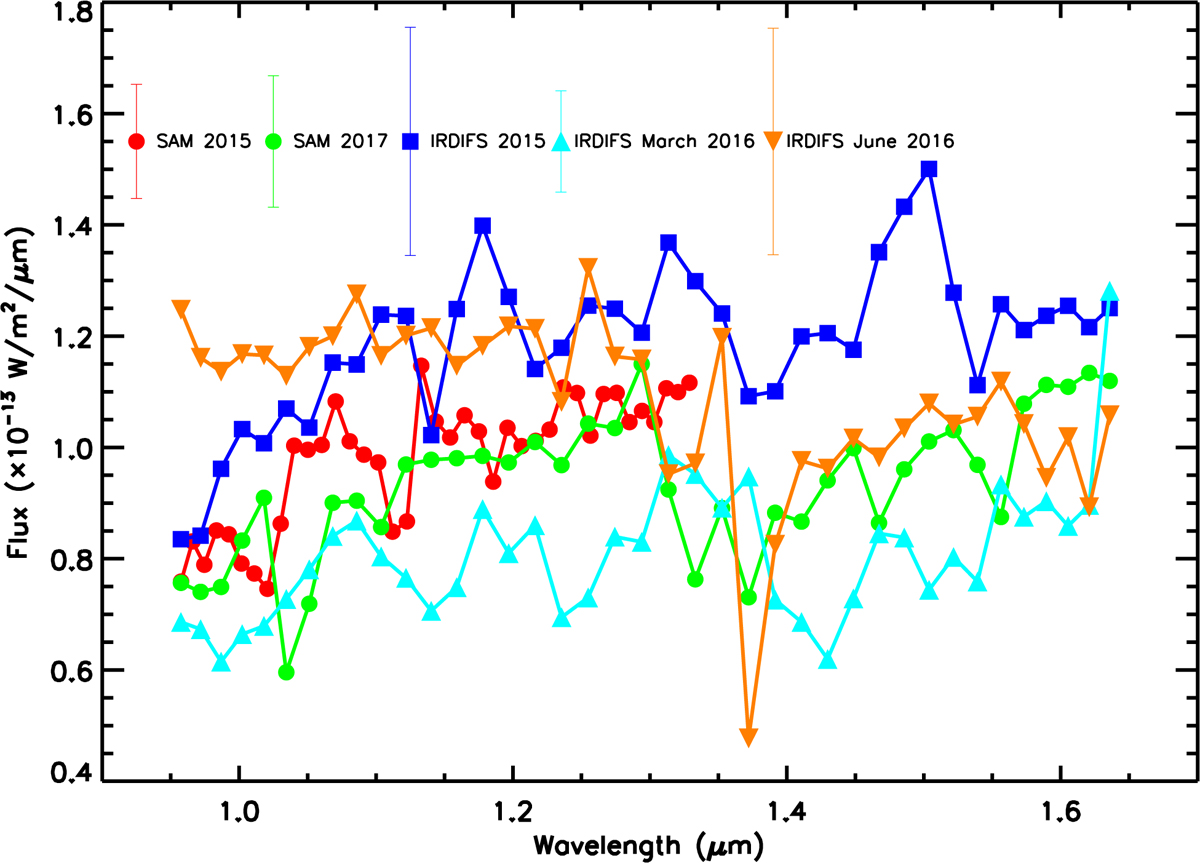
Comparison among the extracted spectra for HD 142527B obtained by both direct imaging and SAM modes of SPHERE in the IFS wavelength range (0.95 − 1.65 μm). In the upper part of the plot is indicated the value of the average value of the error for each spectrum. The SAM IFS spectrum taken in 2015 is limited to the YJ band of IFS (0.95 − 1.35 μm). For a clearer view of the plot all points are connected by continuous lines.
Current usage metrics show cumulative count of Article Views (full-text article views including HTML views, PDF and ePub downloads, according to the available data) and Abstracts Views on Vision4Press platform.
Data correspond to usage on the plateform after 2015. The current usage metrics is available 48-96 hours after online publication and is updated daily on week days.
Initial download of the metrics may take a while.