Fig. 3.
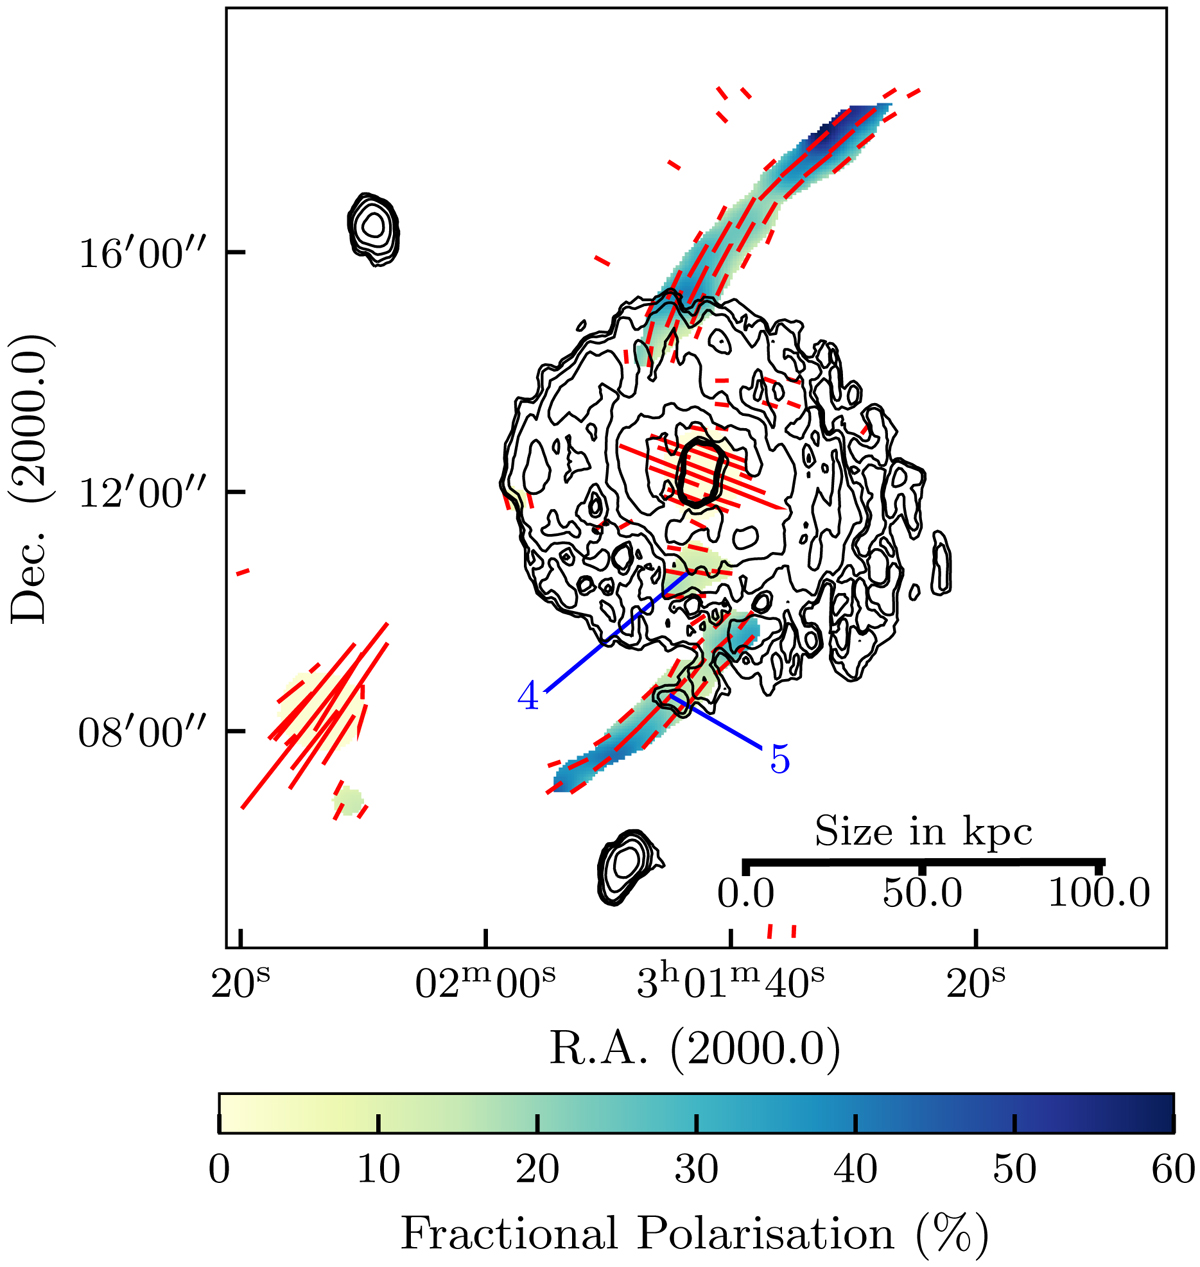
H I contours from Struve et al. (2010) overlaid on the image representing the degree of polarisation at 45″ resolution. The contour levels start at 0.008 Jy beam−1km s−1 and increase in powers of two. The red lines represent the electric field vectors where a vector length of 3″ corresponds to 10 μJy beam−1 of polarised intensity. These field vectors do not represent the absolute values of electric field vectors (see Sect. 2.1 for further details), but illustrate the coherency of the magnetic field along the S-shaped structures.
Current usage metrics show cumulative count of Article Views (full-text article views including HTML views, PDF and ePub downloads, according to the available data) and Abstracts Views on Vision4Press platform.
Data correspond to usage on the plateform after 2015. The current usage metrics is available 48-96 hours after online publication and is updated daily on week days.
Initial download of the metrics may take a while.