Fig. 9.
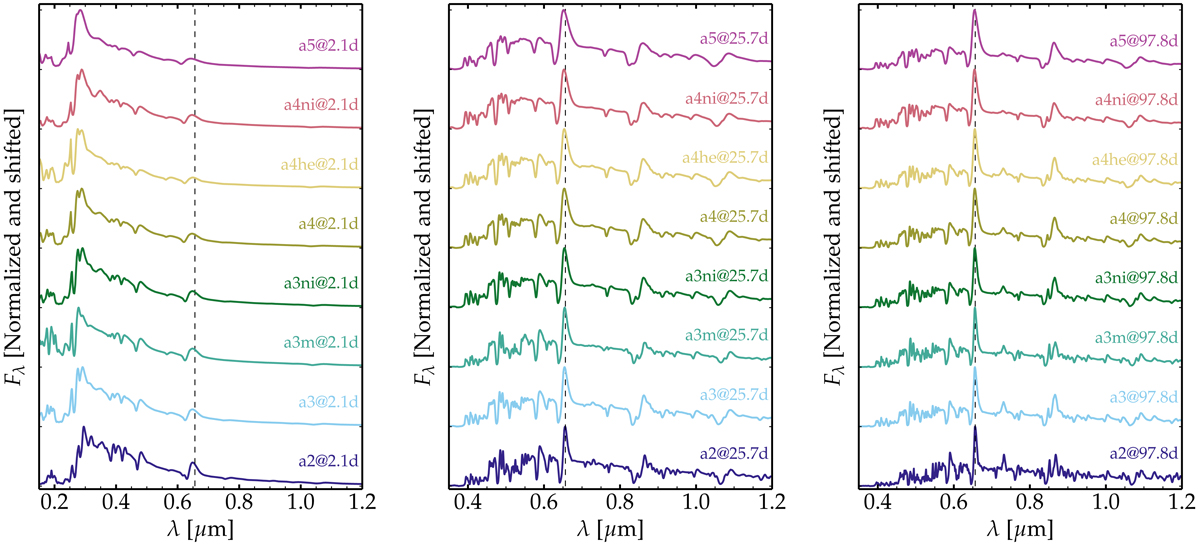
Spectral montage for our set of models at 2.1 d (left panel), 25.7 d (center panel), and 97.8 d (right panel) after explosion (i.e., around the time of bolometric maximum). Each spectrum has been normalized and shifted (a tickmark gives the zero-flux level for each spectrum). The vertical dashed line locates the rest wavelength of Hα and reveals the blue shift of the emission peak at earlier times and higher explosion energies.
Current usage metrics show cumulative count of Article Views (full-text article views including HTML views, PDF and ePub downloads, according to the available data) and Abstracts Views on Vision4Press platform.
Data correspond to usage on the plateform after 2015. The current usage metrics is available 48-96 hours after online publication and is updated daily on week days.
Initial download of the metrics may take a while.