Free Access
Fig. 8.
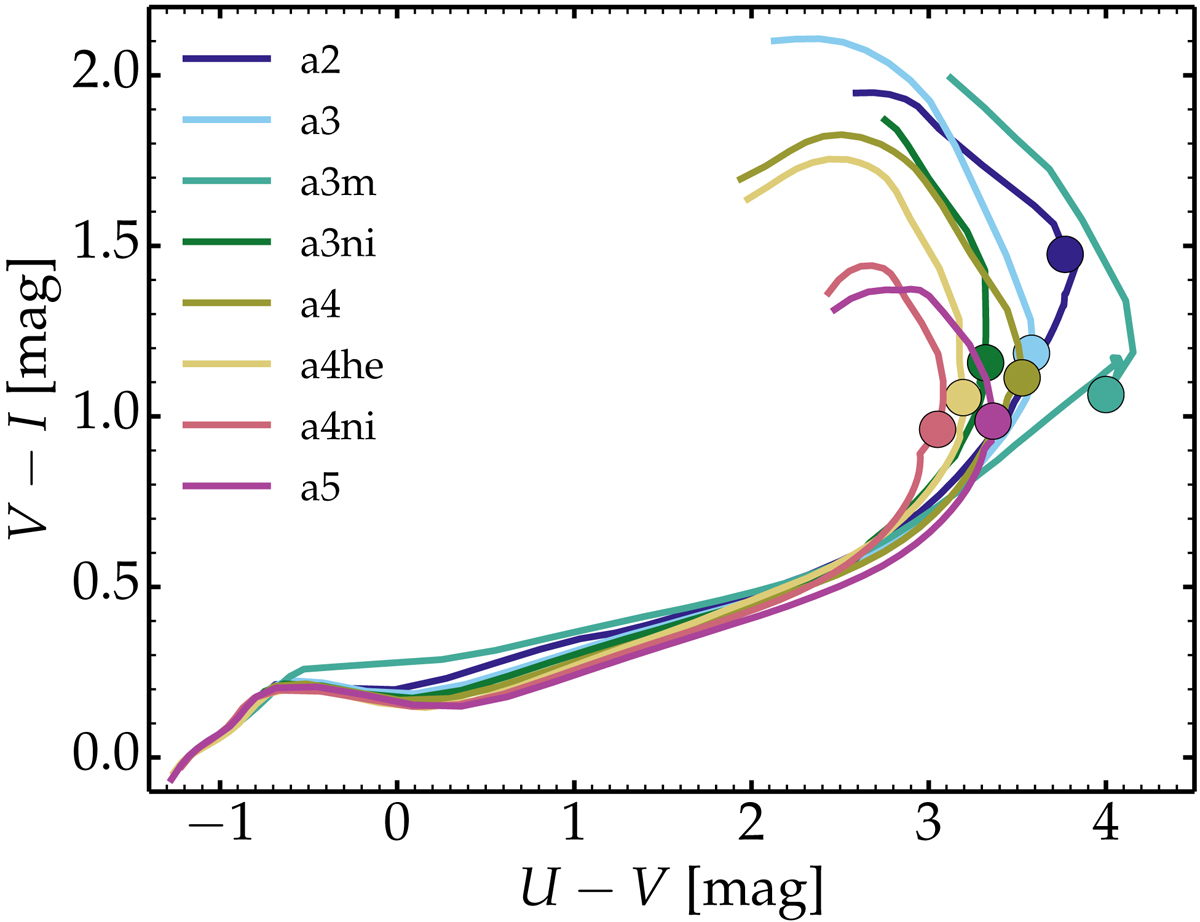
Color-color diagram for our set of models. The filled dot indicates the time of bolometric maximum – all models start in the bottom-left corner with a blue optical color.
Current usage metrics show cumulative count of Article Views (full-text article views including HTML views, PDF and ePub downloads, according to the available data) and Abstracts Views on Vision4Press platform.
Data correspond to usage on the plateform after 2015. The current usage metrics is available 48-96 hours after online publication and is updated daily on week days.
Initial download of the metrics may take a while.