Fig. 6.
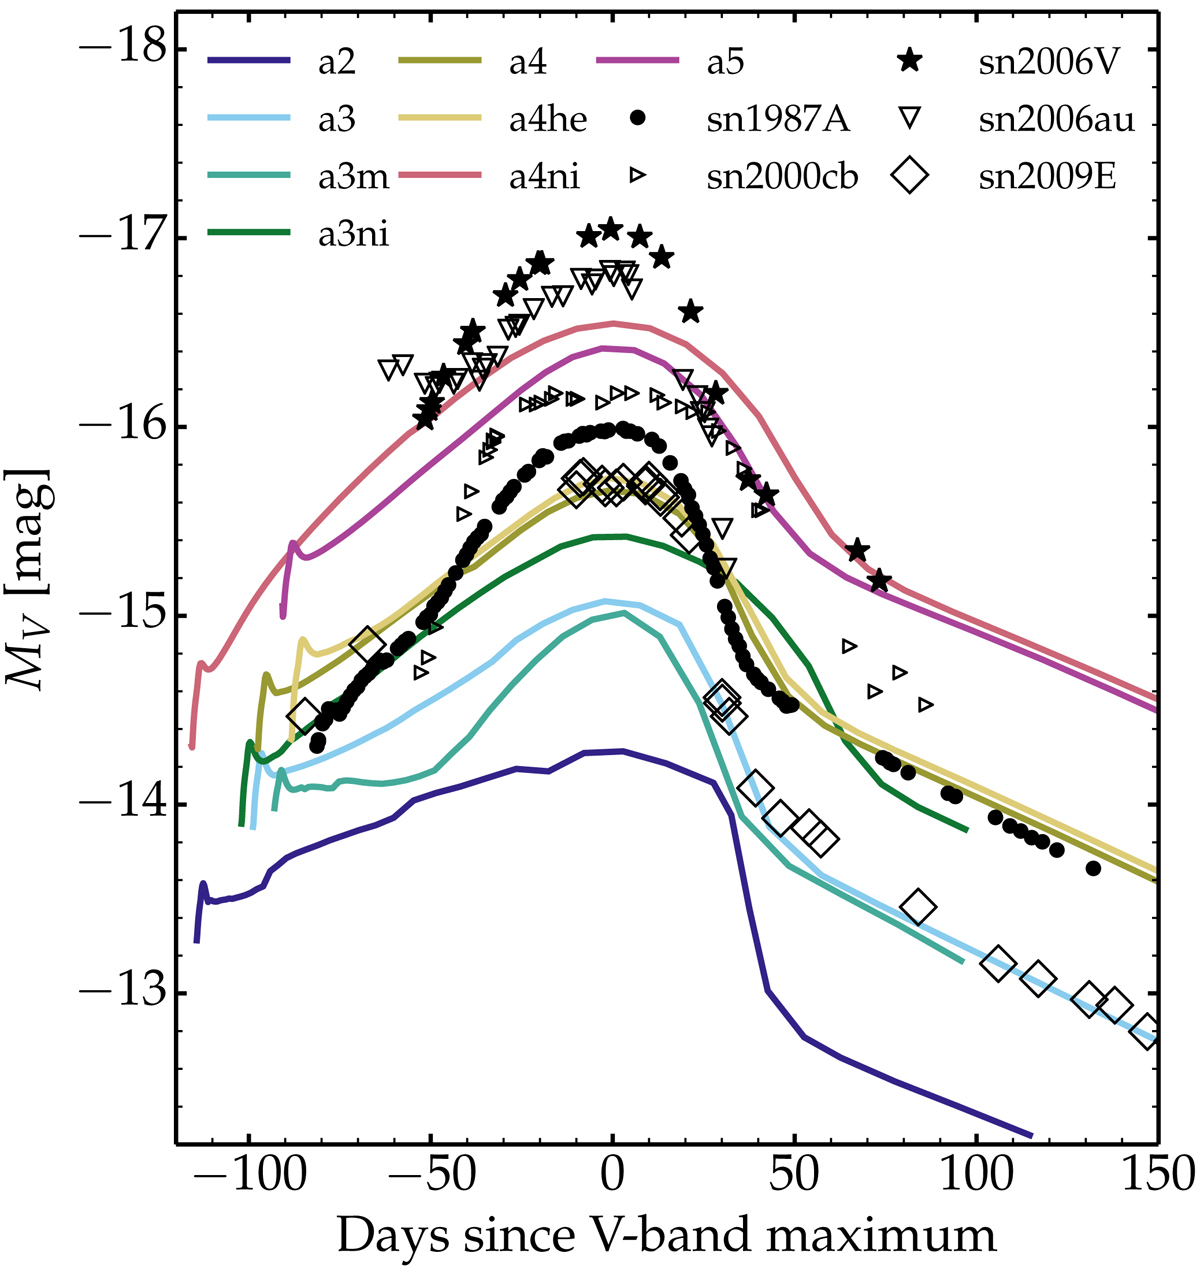
Comparison of the V-band light curves for observed SNe II-pec and for our set of models (the time axis corresponds to the time elapsed since V-band maximum; this time is not accurately known given the width of the light curves and the noise in the observed photometry). If we were to use a negligible reddening for SN 2006au (see Sects. 2.4 and 8.6), its optical brightness and color would be comparable to those of SN 1987A. The V-band light curve of SN 2009mw is very similar to that of SN 2009E and thus not shown (Takáts et al. 2016). The SN properties used to make this figure are listed in Table 1.
Current usage metrics show cumulative count of Article Views (full-text article views including HTML views, PDF and ePub downloads, according to the available data) and Abstracts Views on Vision4Press platform.
Data correspond to usage on the plateform after 2015. The current usage metrics is available 48-96 hours after online publication and is updated daily on week days.
Initial download of the metrics may take a while.