Fig. 5.
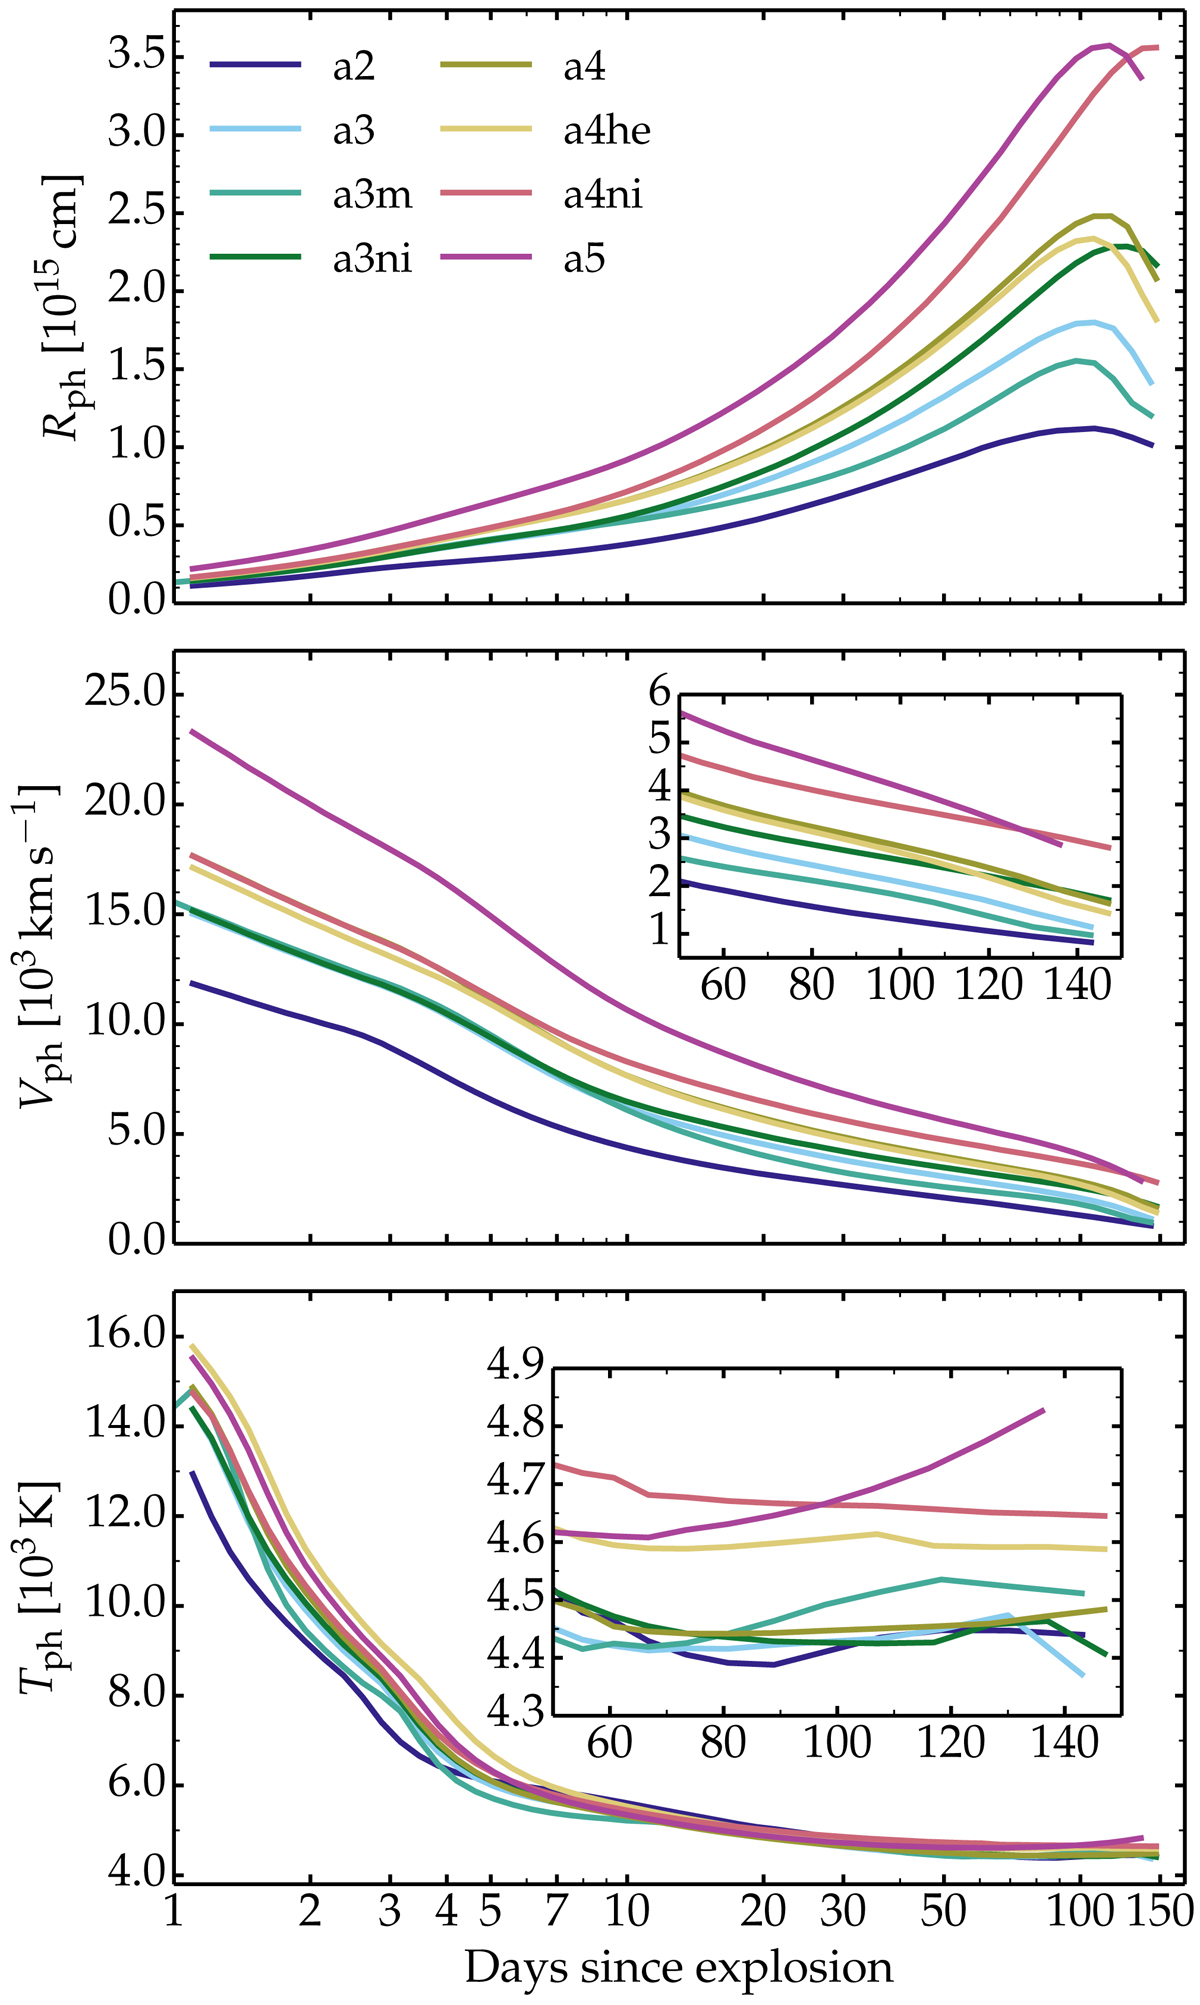
Evolution of the radius, velocity (which can also be deduced directly from the radius and the time elapsed since explosion), and temperature at the photosphere for our set models. The insets in the lower two panels zoom on the epoch around bolometric maximum, when the differences in velocity and temperature between models are harder to discern.
Current usage metrics show cumulative count of Article Views (full-text article views including HTML views, PDF and ePub downloads, according to the available data) and Abstracts Views on Vision4Press platform.
Data correspond to usage on the plateform after 2015. The current usage metrics is available 48-96 hours after online publication and is updated daily on week days.
Initial download of the metrics may take a while.