Fig. 3.
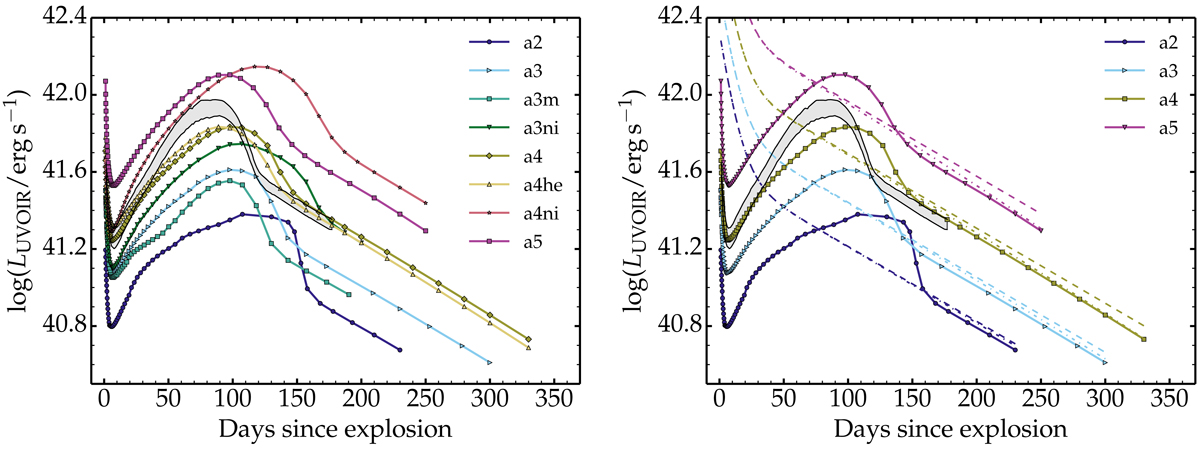
Left panel: UVOIR light curves for our CMFGEN simulations, together with the inferred light curve for SN 1987A (the shaded area is bounded by the UVOIR light curves inferred by Catchpole et al. 1987 and Hamuy et al. 1988). Right panel: same as left, but now for the simulations a2, a3, a4, and a5 (which differ primarily in ejecta kinetic energy and 56Ni mass). We also show the total decay power emitted (dashed line) and absorbed (dash-dotted line) for each model.
Current usage metrics show cumulative count of Article Views (full-text article views including HTML views, PDF and ePub downloads, according to the available data) and Abstracts Views on Vision4Press platform.
Data correspond to usage on the plateform after 2015. The current usage metrics is available 48-96 hours after online publication and is updated daily on week days.
Initial download of the metrics may take a while.