Fig. 16.
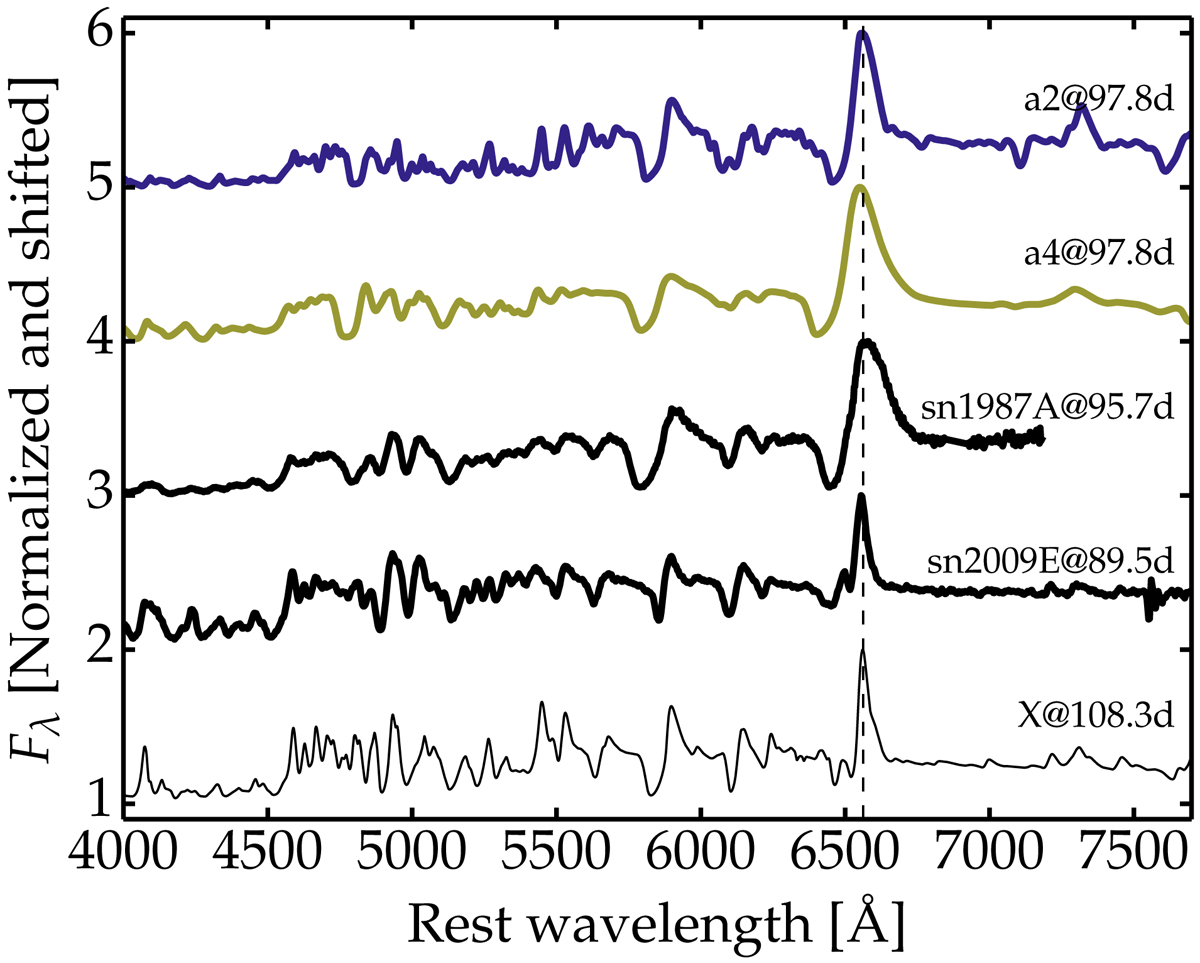
Comparison between the spectra of SN 2009E, SN 1987A, and models a2 and a4 around the time of maximum brightness. We also overplot model X (used to model the low energy Type II-P SN 2008bk; Lisakov et al. 2017) to show that a lower energy than used for model a2 is needed to explain the very narrow Hα. All spectra are normalized and shifted vertically for visibility. Observations were corrected for redshift but not for reddening.
Current usage metrics show cumulative count of Article Views (full-text article views including HTML views, PDF and ePub downloads, according to the available data) and Abstracts Views on Vision4Press platform.
Data correspond to usage on the plateform after 2015. The current usage metrics is available 48-96 hours after online publication and is updated daily on week days.
Initial download of the metrics may take a while.