Fig. 12.
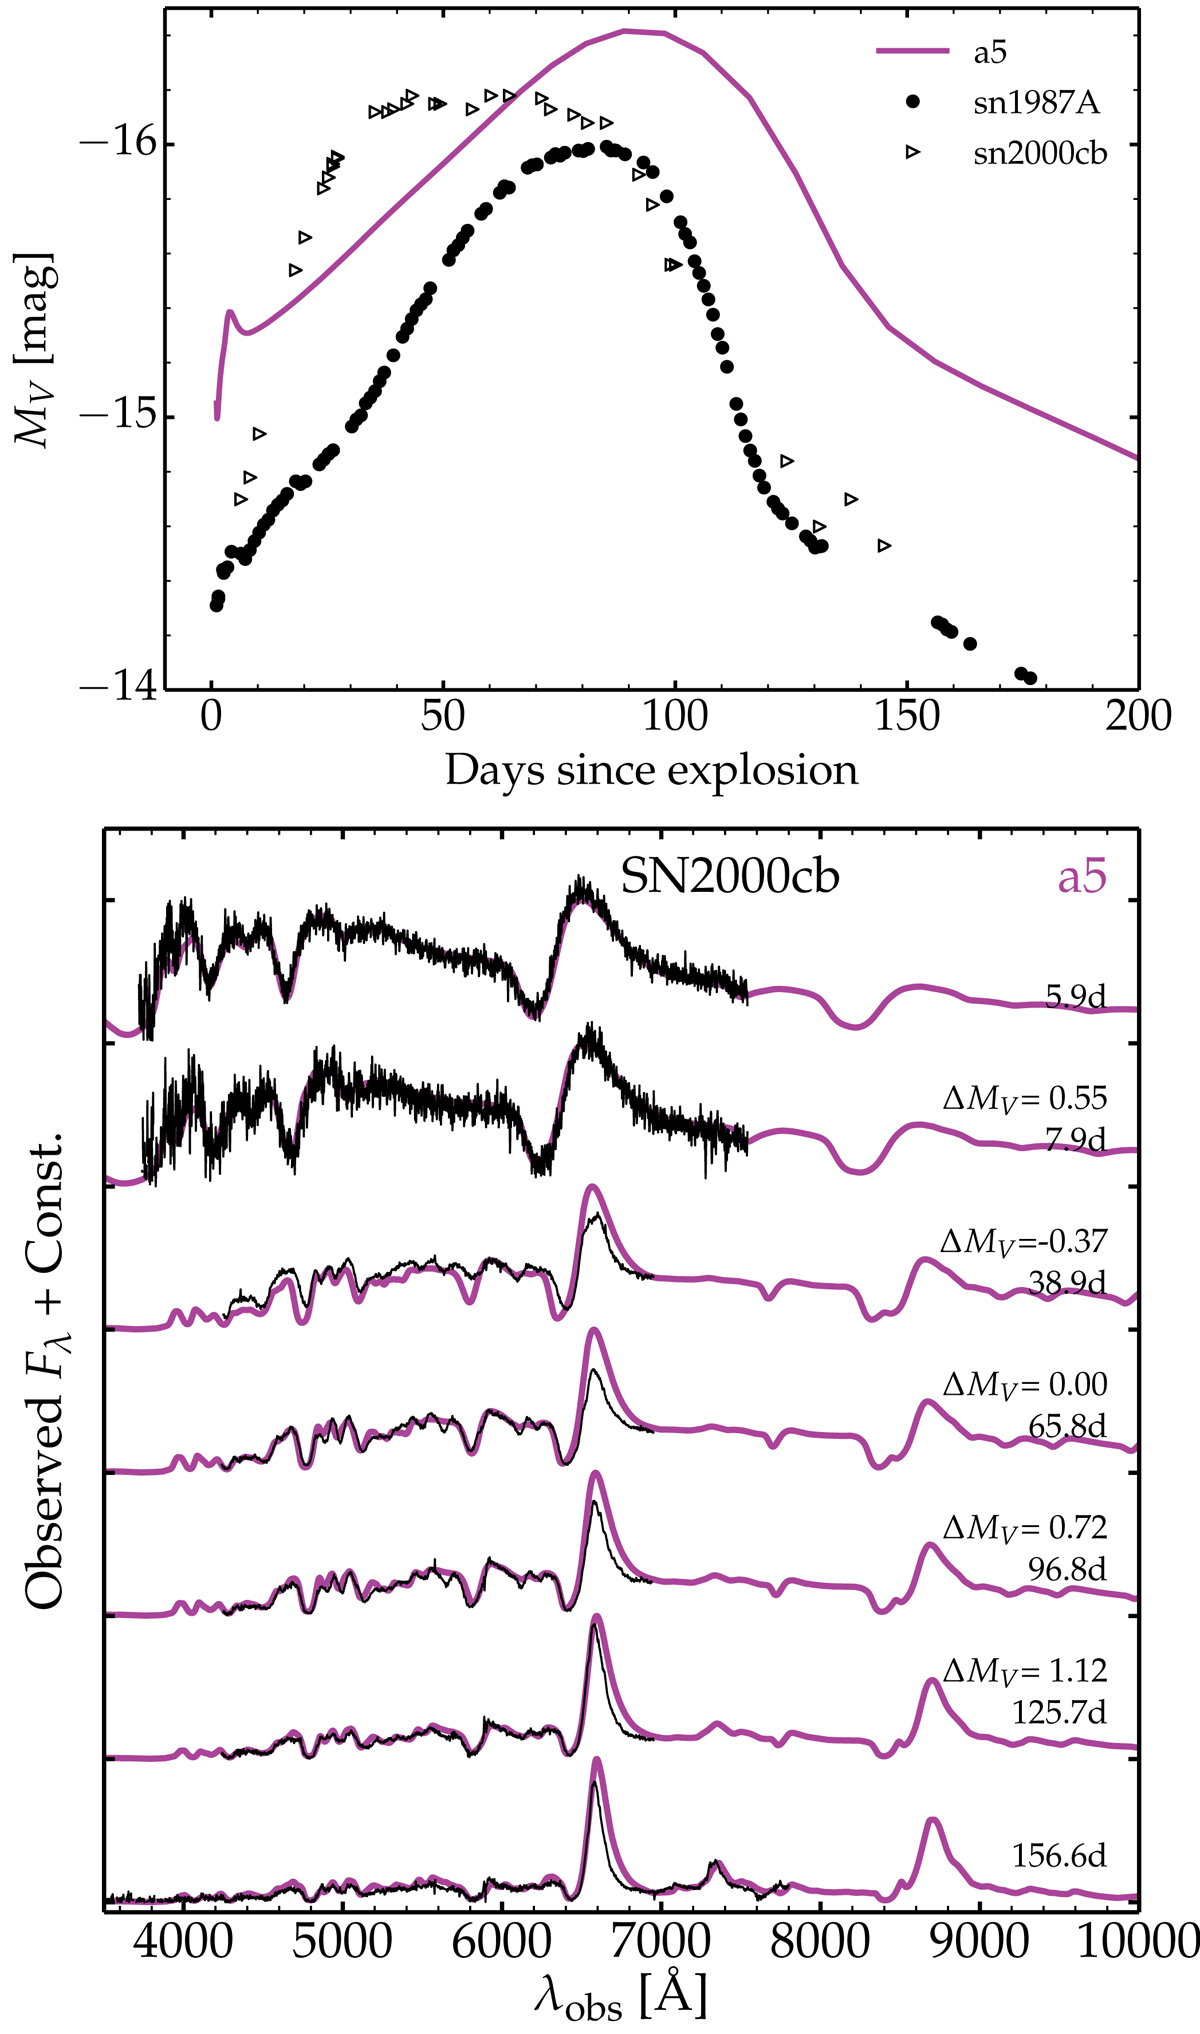
Top panel: absolute V-band light curves for SN 2000cb together with the results for model a5 (we also add SN 1987A). Bottom panel: multiepoch spectra for models a5 compared with the observed spectra of SN 2000cb. The model is redshifted and reddened (see Sect. 2). At each epoch, the spectra are normalized (in this case at 6000 Å) and then shifted vertically. The label ΔMV gives the V-band magnitude difference between observations and model at each time (whenever we can interpolate between photometric data points).
Current usage metrics show cumulative count of Article Views (full-text article views including HTML views, PDF and ePub downloads, according to the available data) and Abstracts Views on Vision4Press platform.
Data correspond to usage on the plateform after 2015. The current usage metrics is available 48-96 hours after online publication and is updated daily on week days.
Initial download of the metrics may take a while.