Fig. 11.
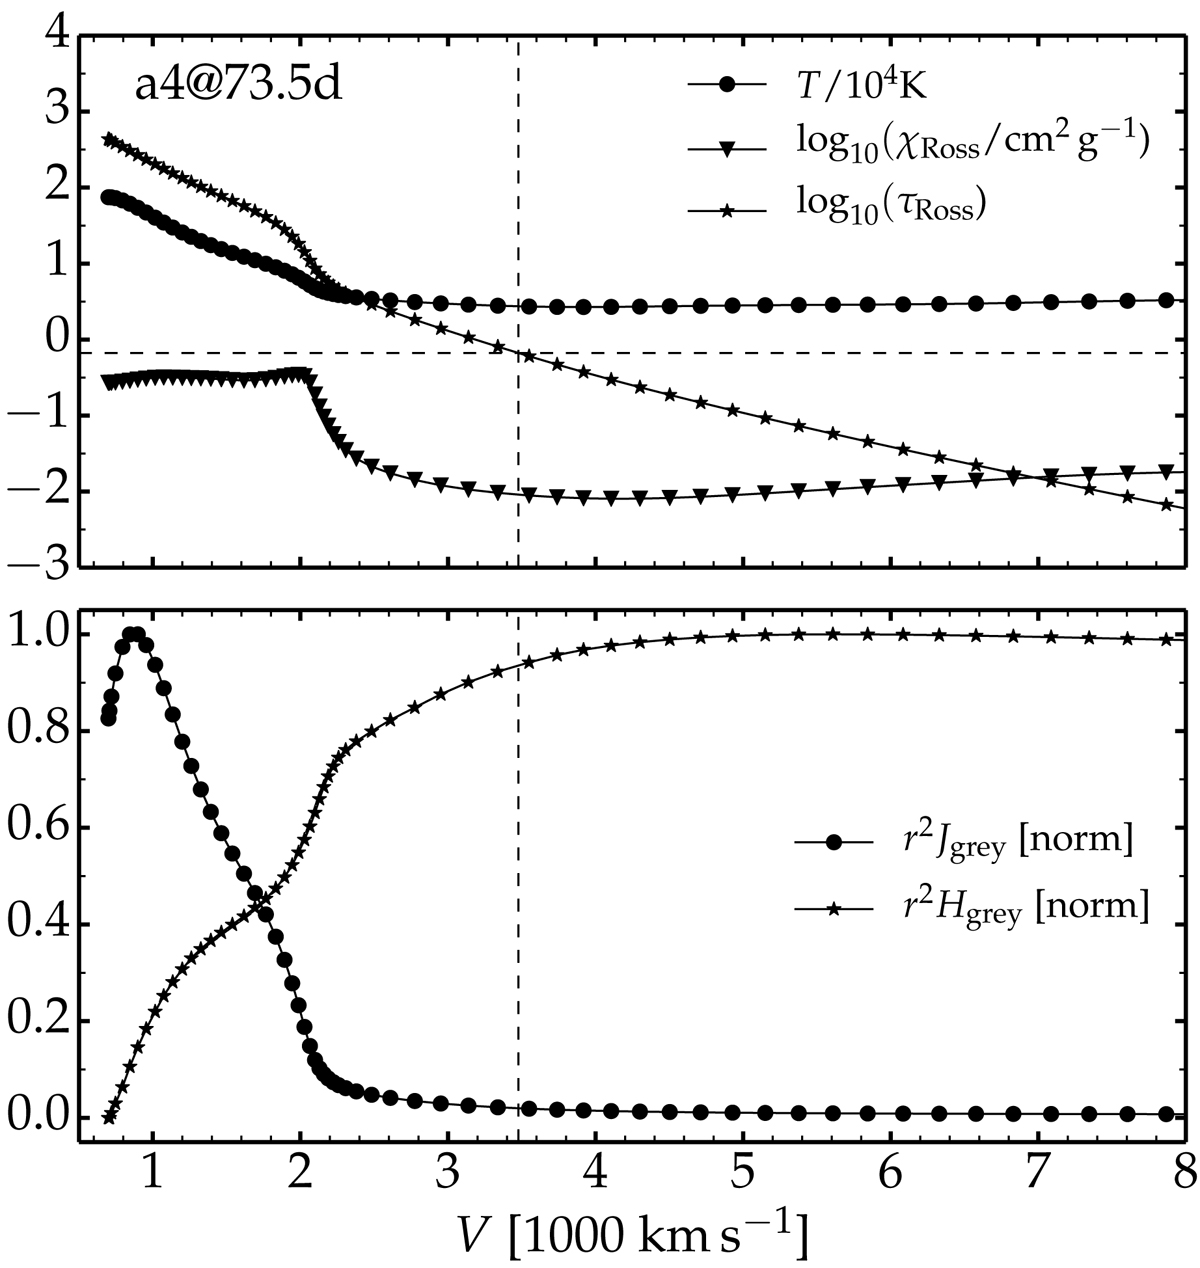
Photospheric structure at 73.5 d after explosion for model a4. Top panel: temperature, the Rosseland-mean opacity, and the Rosseland-mean optical depth. The dashed lines help visualize the location of the photosphere (determined using the Rosseland-mean opacity). Bottom panel: evolution of the gray mean intensity and the gray flux (scaled by r2, where r is the local radius, and subsequently normalized) computed by CMFGEN.
Current usage metrics show cumulative count of Article Views (full-text article views including HTML views, PDF and ePub downloads, according to the available data) and Abstracts Views on Vision4Press platform.
Data correspond to usage on the plateform after 2015. The current usage metrics is available 48-96 hours after online publication and is updated daily on week days.
Initial download of the metrics may take a while.