Fig. 10.
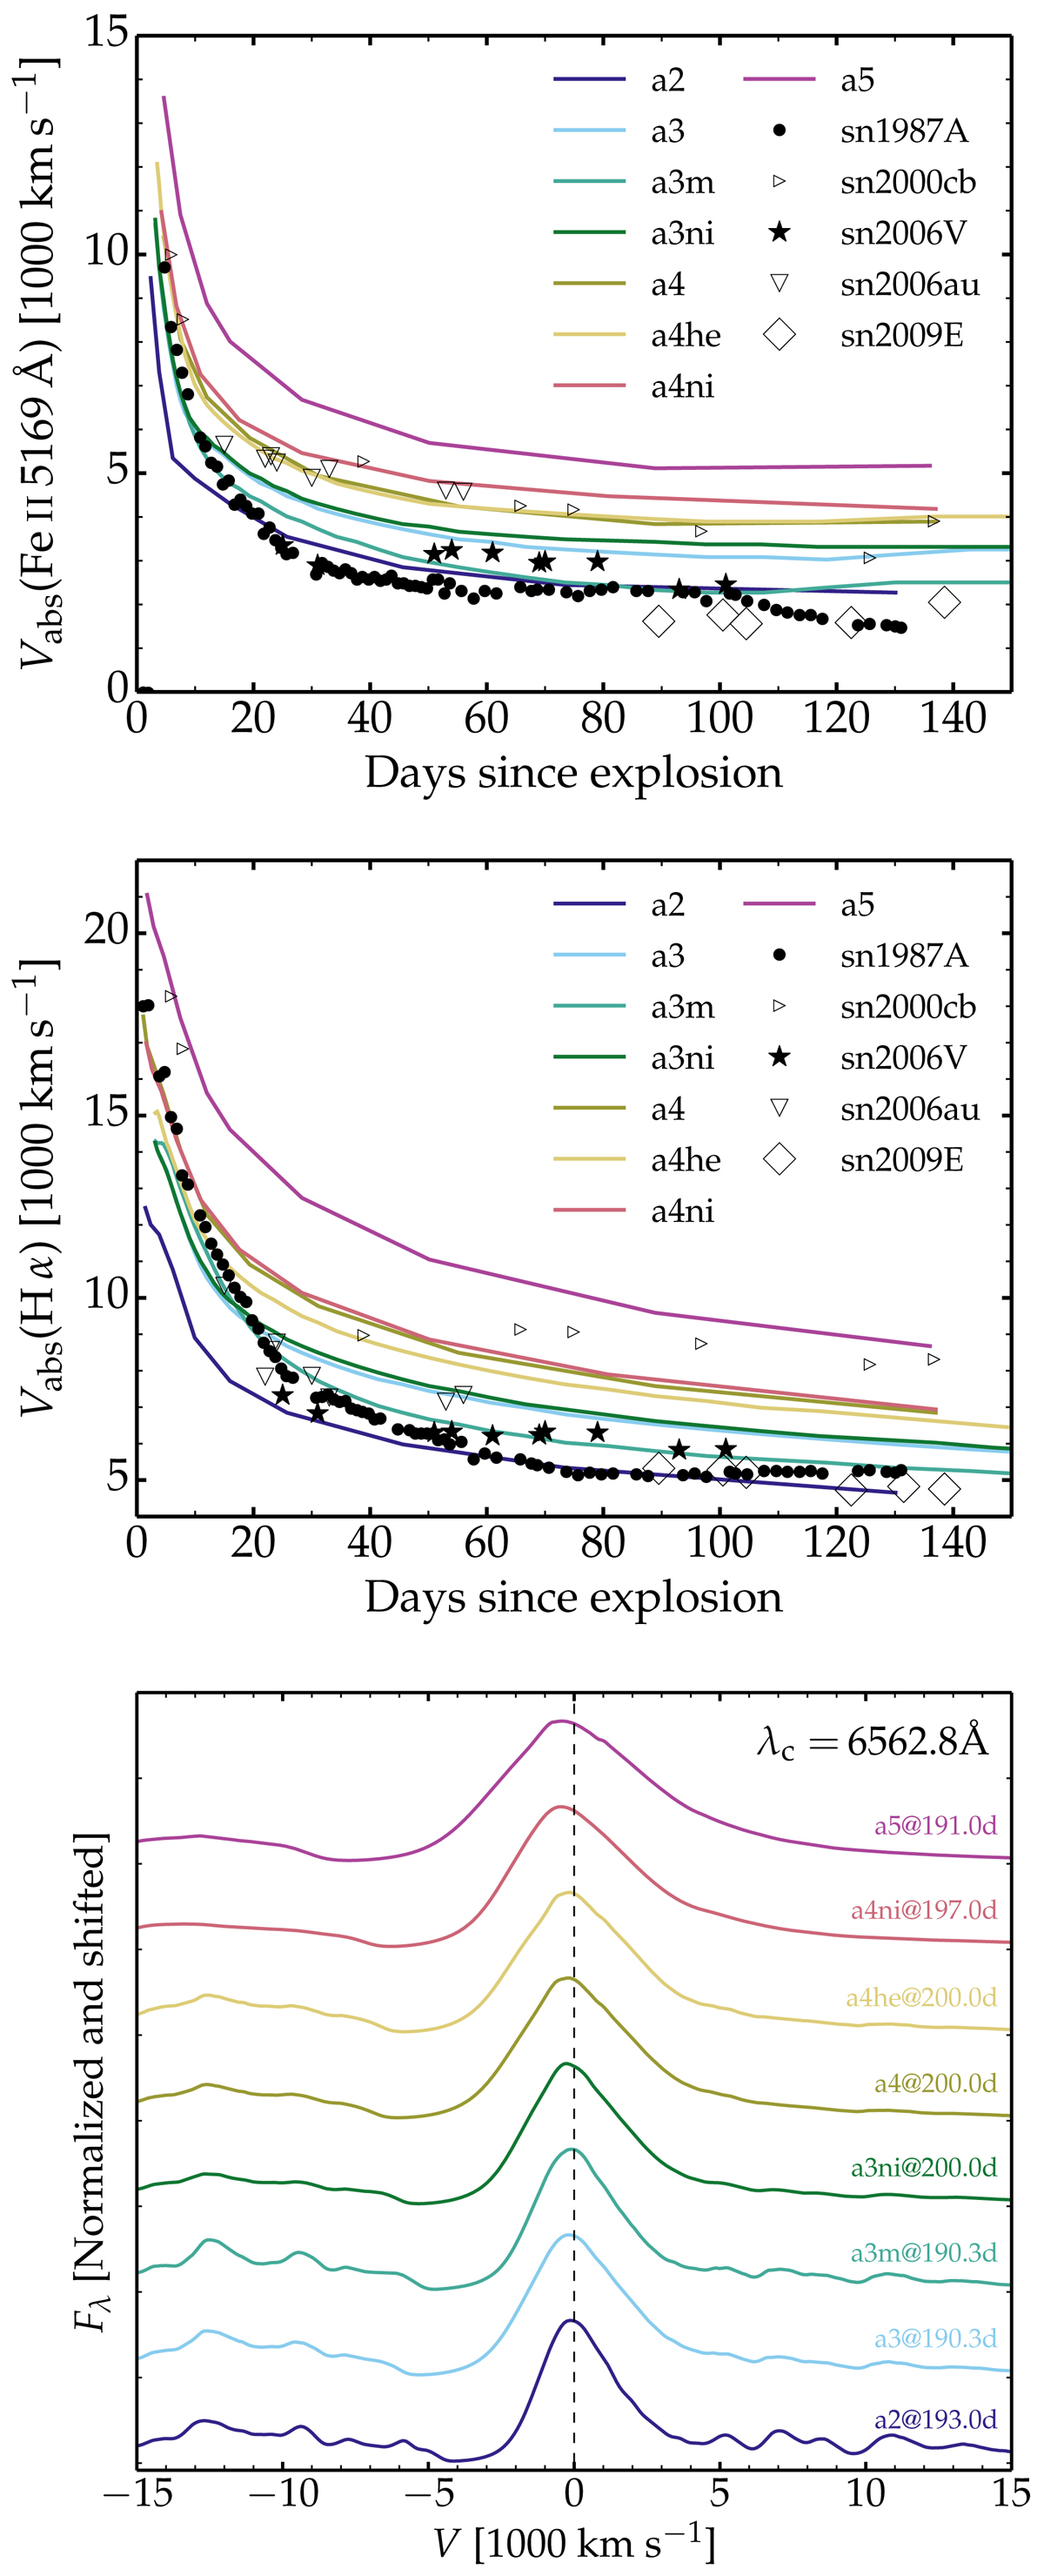
Top panel: doppler velocity at maximum absorption in Fe II 5169 Å for our set of models. We also overplot our measurements for Type II-pec SNe 1987A, 2000cb, 2006V, 2006au, and 2009E. Middle panel: same as top, but now for Hα. A gaussian smoothing with a width of 10–20 Å is used for noisy spectra or when the Hα suffers from strong overlap (e.g., for SN 2006au). In the latter case, the measurement is merely indicative. Bottom panel: montage of spectra for our set of models showing the Hα line profile in Doppler-velocity space at about 200 d after explosion.
Current usage metrics show cumulative count of Article Views (full-text article views including HTML views, PDF and ePub downloads, according to the available data) and Abstracts Views on Vision4Press platform.
Data correspond to usage on the plateform after 2015. The current usage metrics is available 48-96 hours after online publication and is updated daily on week days.
Initial download of the metrics may take a while.