Fig. 7.
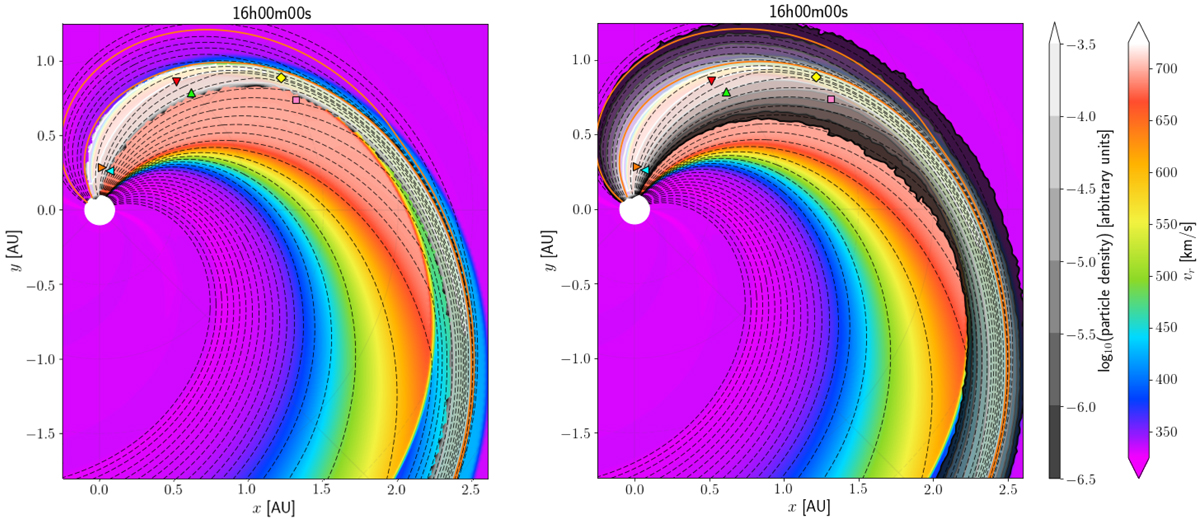
Particle densities drawn in grey shades on top of the radial velocity profile of the background solar wind, 16 h after the particle injection (online movie). The left and right panels correspond to the cases without and with perpendicular diffusion, respectively. The solid orange and dashed black lines represent magnetic field lines, drawn with a constant longitudinal separation of 3.5° at r = 1 AU. The markers correspond to the location of the different observers discussed in the text.
Current usage metrics show cumulative count of Article Views (full-text article views including HTML views, PDF and ePub downloads, according to the available data) and Abstracts Views on Vision4Press platform.
Data correspond to usage on the plateform after 2015. The current usage metrics is available 48-96 hours after online publication and is updated daily on week days.
Initial download of the metrics may take a while.