Fig. 3.
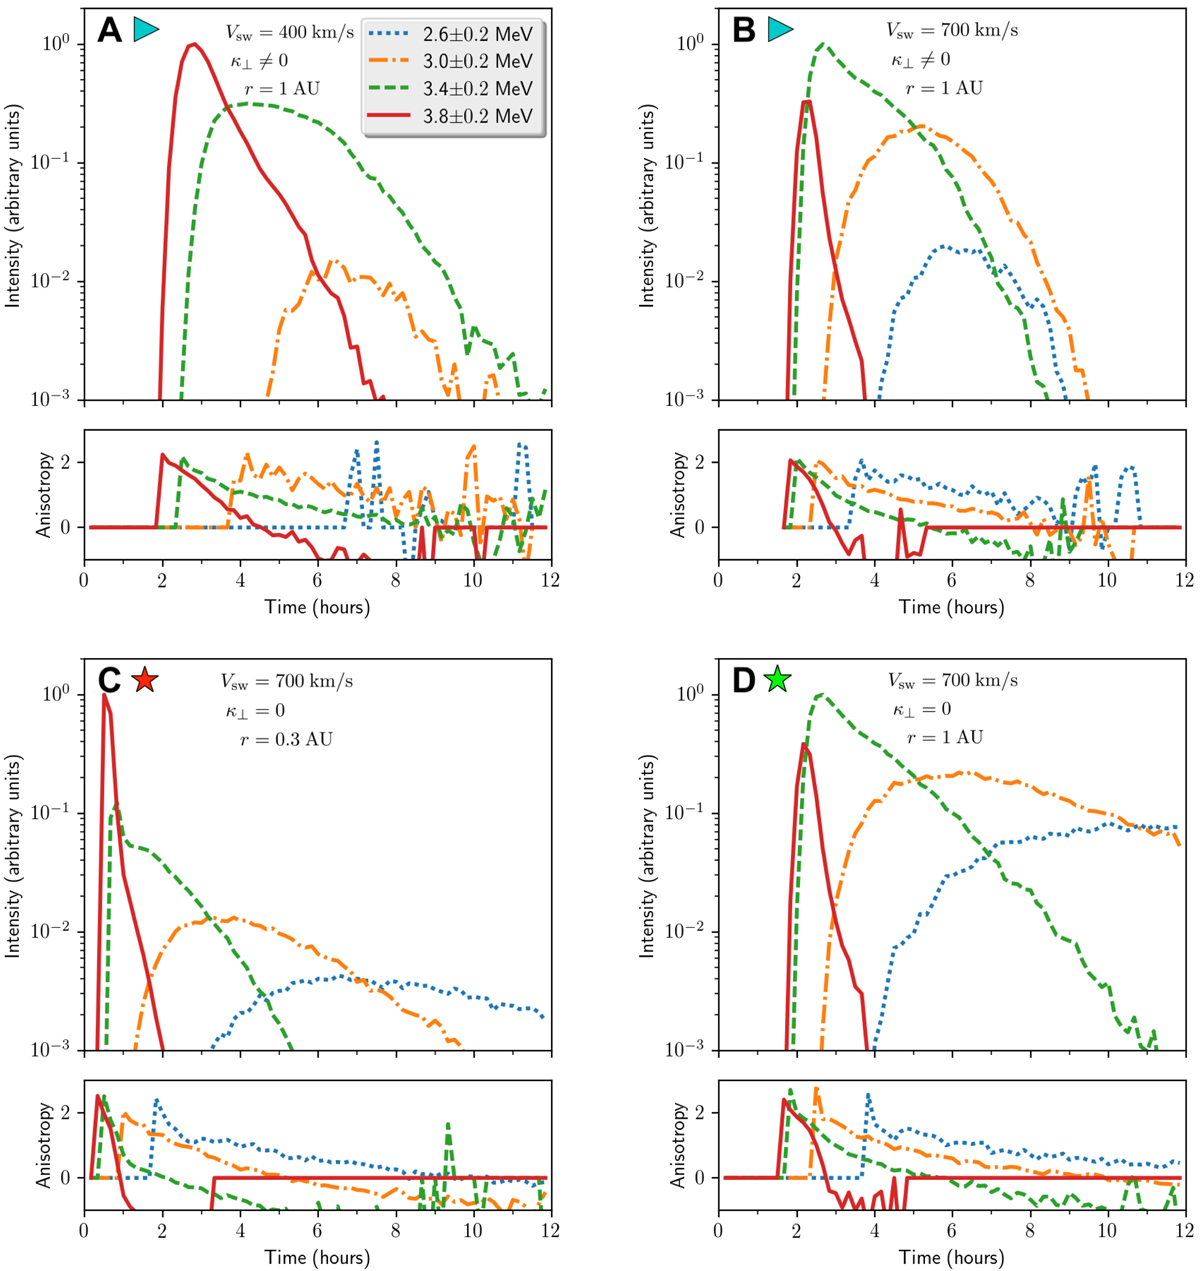
Intensity and anisotropy time profiles for different energy channels of protons injected with an initial energy of 4 MeV. All the effects of the FTE are included. The first row shows the profiles for observer A located in the slow (panel A) and fast (panel B) solar wind. The last row shows the profiles for corotating observers C (panel C) and D (panel D).
Current usage metrics show cumulative count of Article Views (full-text article views including HTML views, PDF and ePub downloads, according to the available data) and Abstracts Views on Vision4Press platform.
Data correspond to usage on the plateform after 2015. The current usage metrics is available 48-96 hours after online publication and is updated daily on week days.
Initial download of the metrics may take a while.