Fig. 8
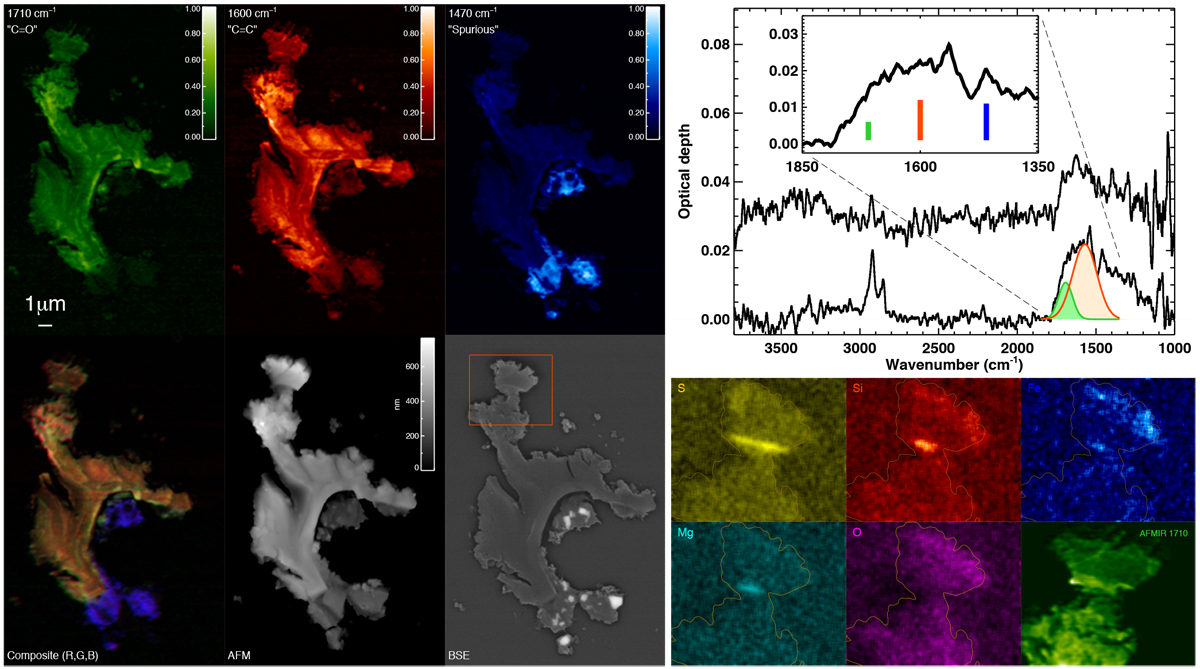
Left: DC16-14-309-b AFMIR maps recorded at 1710 cm−1 (green), 1600 cm−1 (red), and 1470 cm−1 (blue), composite (red, green blue) image of the three maps, AFM height, and back-scattered electrons (BSE) image (the bottom-right bright spots are associated with a contamination, with recorded spectra shown in Fig. 9). The orange square delineates the region analysed by EDX. Top right: far-field spectrum. Vertical lines in the inset indicate the laser settings used to map the sample. Bottom right: sulphur, silicon, iron, magnesium and oxygen X-ray maps. The bright spot in Si, Mg and Fe corresponds to silicates. The more extended sulphur spots probably include some elemental sulphur from the sample preparation. The AFMIR 1710 cm−1 map is shown at the same scale.
Current usage metrics show cumulative count of Article Views (full-text article views including HTML views, PDF and ePub downloads, according to the available data) and Abstracts Views on Vision4Press platform.
Data correspond to usage on the plateform after 2015. The current usage metrics is available 48-96 hours after online publication and is updated daily on week days.
Initial download of the metrics may take a while.