Fig. 7
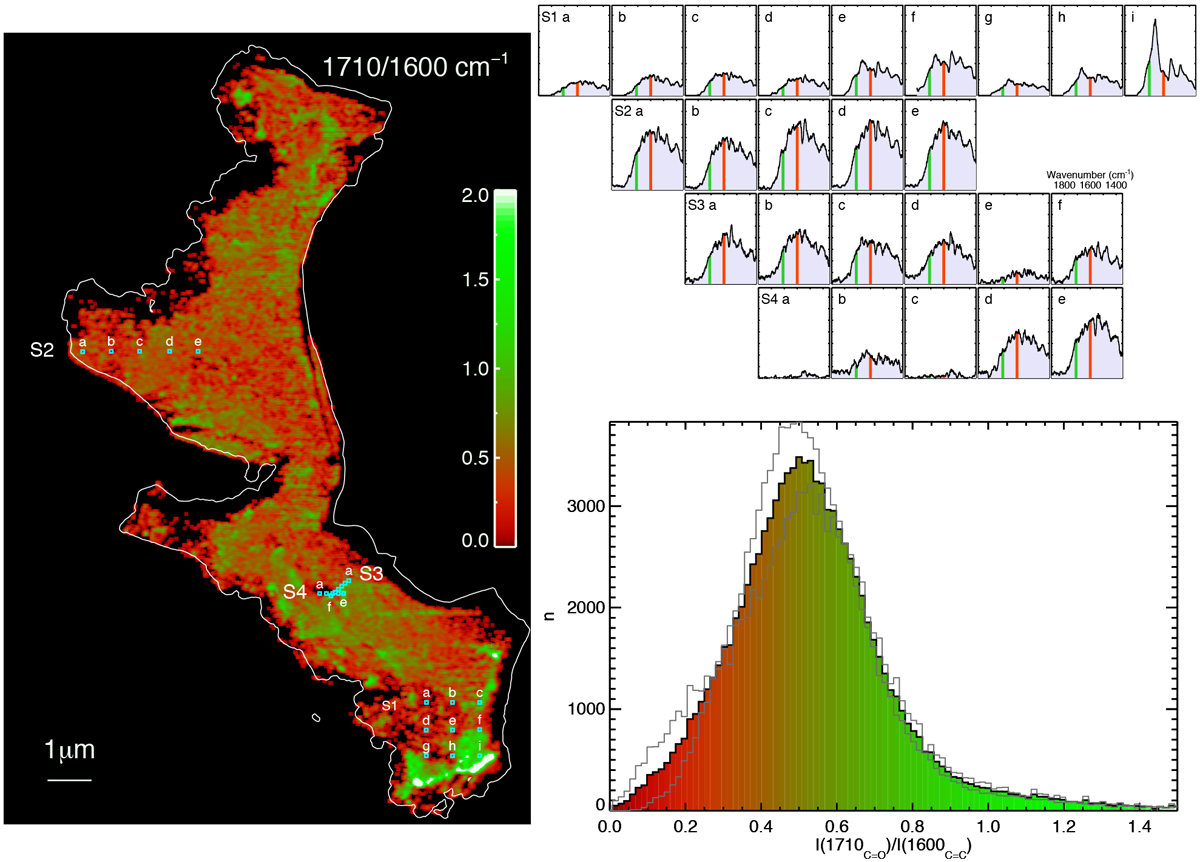
DC16-14-309-a. Left: ratio of the AFMIR maps at 1710 and 1600 cm−1. The white isocontour delineates the height corresponding to 5% of the maximum height measured by the AFM tip. Top right: AFMIR spectral maps in the 1900–1350 cm−1 range (labelled S1 to S4, performed in selected locations shown on the map). Vertical lines mark the 1710 and 1600 cm−1 wavenumber positions. Bottom right: histogram of the ratio of the AFMIR maps at 1710 and 1600 cm−1.
Current usage metrics show cumulative count of Article Views (full-text article views including HTML views, PDF and ePub downloads, according to the available data) and Abstracts Views on Vision4Press platform.
Data correspond to usage on the plateform after 2015. The current usage metrics is available 48-96 hours after online publication and is updated daily on week days.
Initial download of the metrics may take a while.