Fig. 6
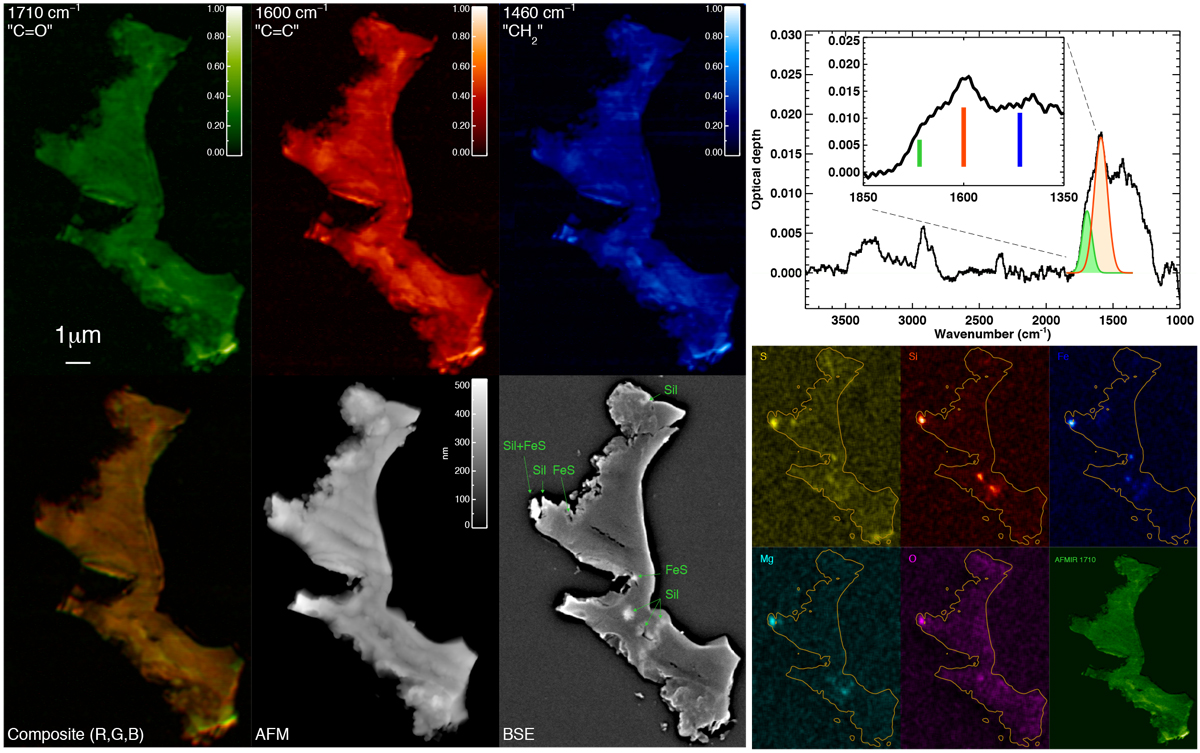
Left: DC16-14-309-a AFMIR maps recorded at 1710 cm−1 (green), 1600 cm−1 (red), and 1460 cm−1 (blue), composite (red, green, blue) image of the three maps, and AFM height and back-scattered electron (BSE) image of UCAMM DC16-14-309-a. Top right: far-field spectrum. Vertical lines in the inset indicate the laser settings used to map the sample. Bottom right: sulphur, silicon, iron, magnesium, and oxygen X-ray maps. The largest minerals identified are labelled (Sil: silicates; FeS: iron sulphide). We note that the very bottom-right area seen in S without counterpart in Fe probably corresponds to elemental sulphur from the sample preparation. The AFMIR 1710 cm−1 map is shown at the same scale.
Current usage metrics show cumulative count of Article Views (full-text article views including HTML views, PDF and ePub downloads, according to the available data) and Abstracts Views on Vision4Press platform.
Data correspond to usage on the plateform after 2015. The current usage metrics is available 48-96 hours after online publication and is updated daily on week days.
Initial download of the metrics may take a while.