Fig. 5
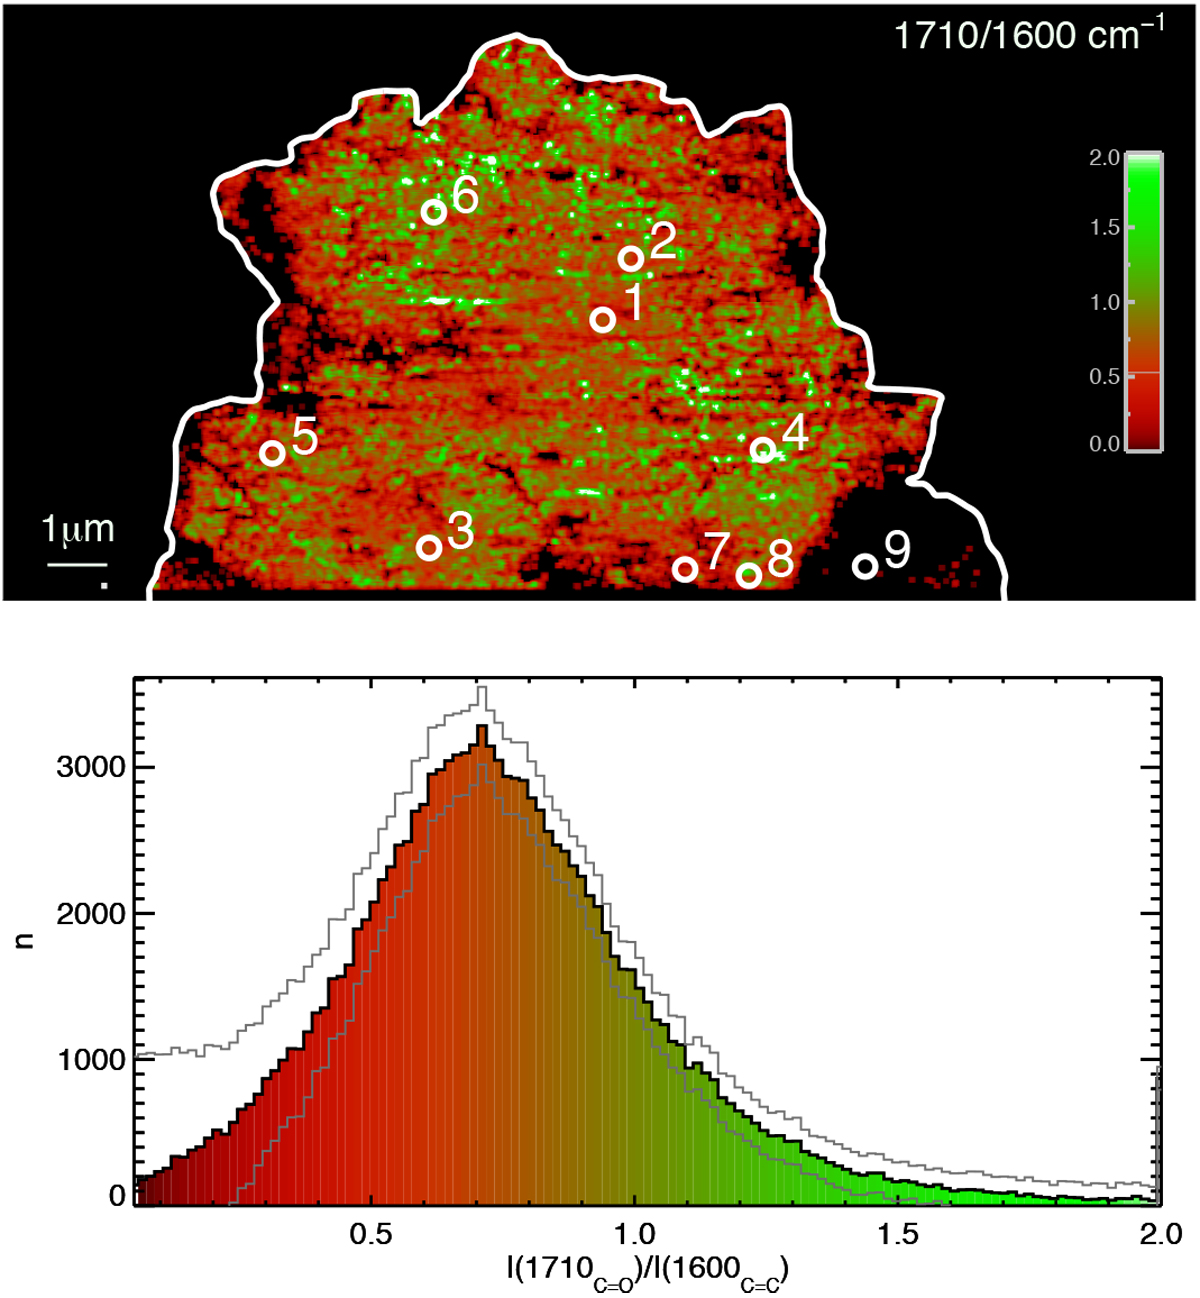
Top: enhanced contrast palette image of the ratio of the AFMIR intensity maps at 1710 and 1600 cm−1 of region of interest “A”. The white contour delineates the AFM sample boundaries as defined by the AFM. The white circles denote the locations where full spectra were acquired. Bottom: histogram of the ratio of the AFMIR maps at 1710 and 1600 cm−1 for the whole region of interest “A”.
Current usage metrics show cumulative count of Article Views (full-text article views including HTML views, PDF and ePub downloads, according to the available data) and Abstracts Views on Vision4Press platform.
Data correspond to usage on the plateform after 2015. The current usage metrics is available 48-96 hours after online publication and is updated daily on week days.
Initial download of the metrics may take a while.