Fig. 4
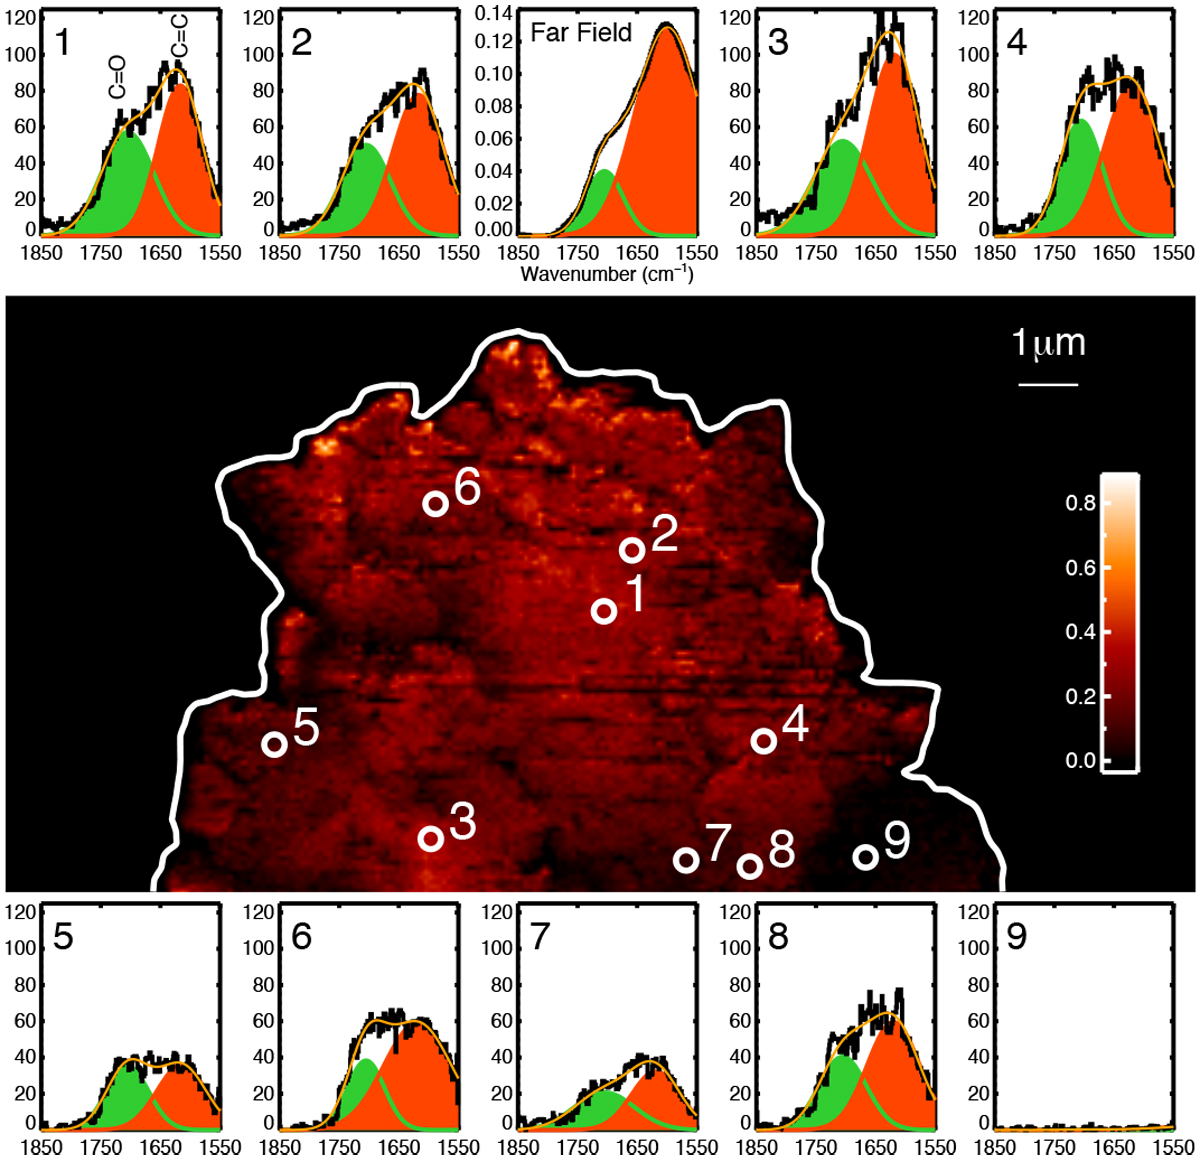
AFMIR signal map at 1600 cm−1 of the region of interest “A” and overlaid selected positions (1–9) with full spectra surrounding the image. The far-field spectrum is shown in the same wavenumber range. The white isocontour delineates the height corresponding to 15% of the maximum height measured by the AFM tip. It delineates the AFM sample boundaries and outlines the overall particle shape.
Current usage metrics show cumulative count of Article Views (full-text article views including HTML views, PDF and ePub downloads, according to the available data) and Abstracts Views on Vision4Press platform.
Data correspond to usage on the plateform after 2015. The current usage metrics is available 48-96 hours after online publication and is updated daily on week days.
Initial download of the metrics may take a while.