Fig. 3
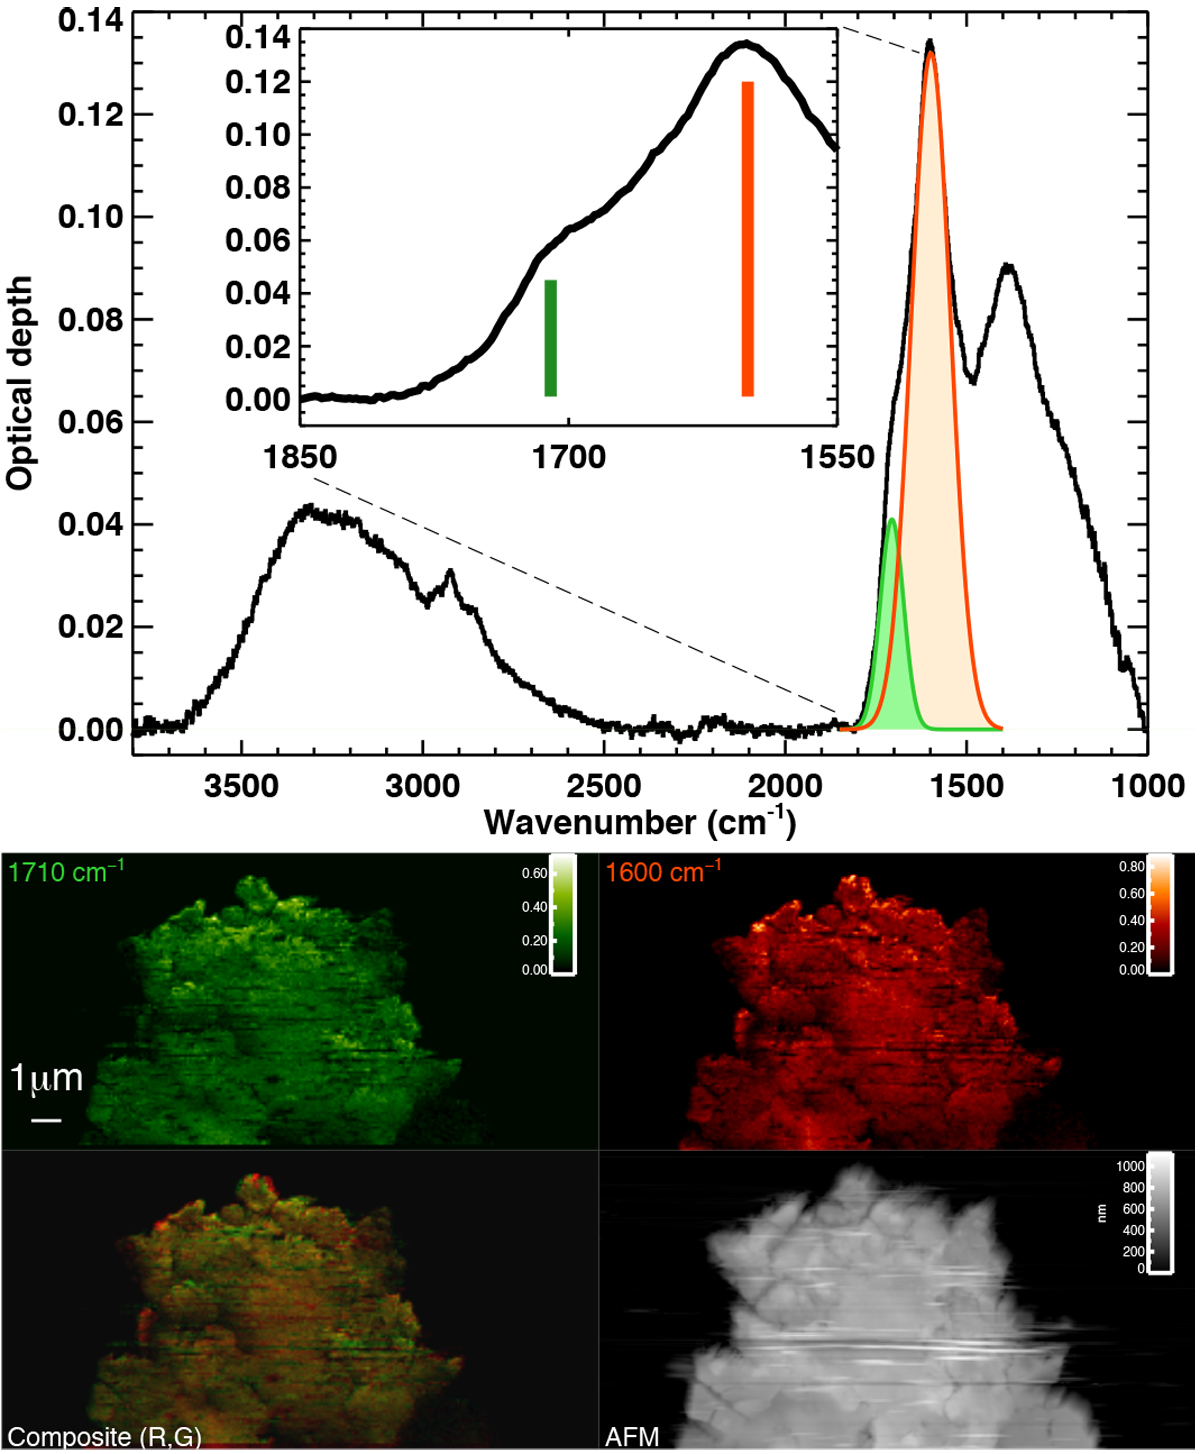
Top: far-field spectrum (global spectrum acquired with a Nicolet Continuum II IR microscope on the SOLEIL SMIS beam line) of UCAMM DC16-07-18b. The inset displays the spectrum in the range covered by the laser for the AFMIR measurements. The band at 1710 cm−1 (green) is attributed to C=O, while the band at 1600 cm−1 (red) reflects the presence of C=C/C=N bonds. Bottom: false colour maps showing the measured intensity maps of the bands at 1710 cm−1 (green) and 1600 cm−1 (red), and a composite image (red-green). Bottom right: topographical map recorded during the AFM measurements (greyscale).
Current usage metrics show cumulative count of Article Views (full-text article views including HTML views, PDF and ePub downloads, according to the available data) and Abstracts Views on Vision4Press platform.
Data correspond to usage on the plateform after 2015. The current usage metrics is available 48-96 hours after online publication and is updated daily on week days.
Initial download of the metrics may take a while.