Fig. A.1
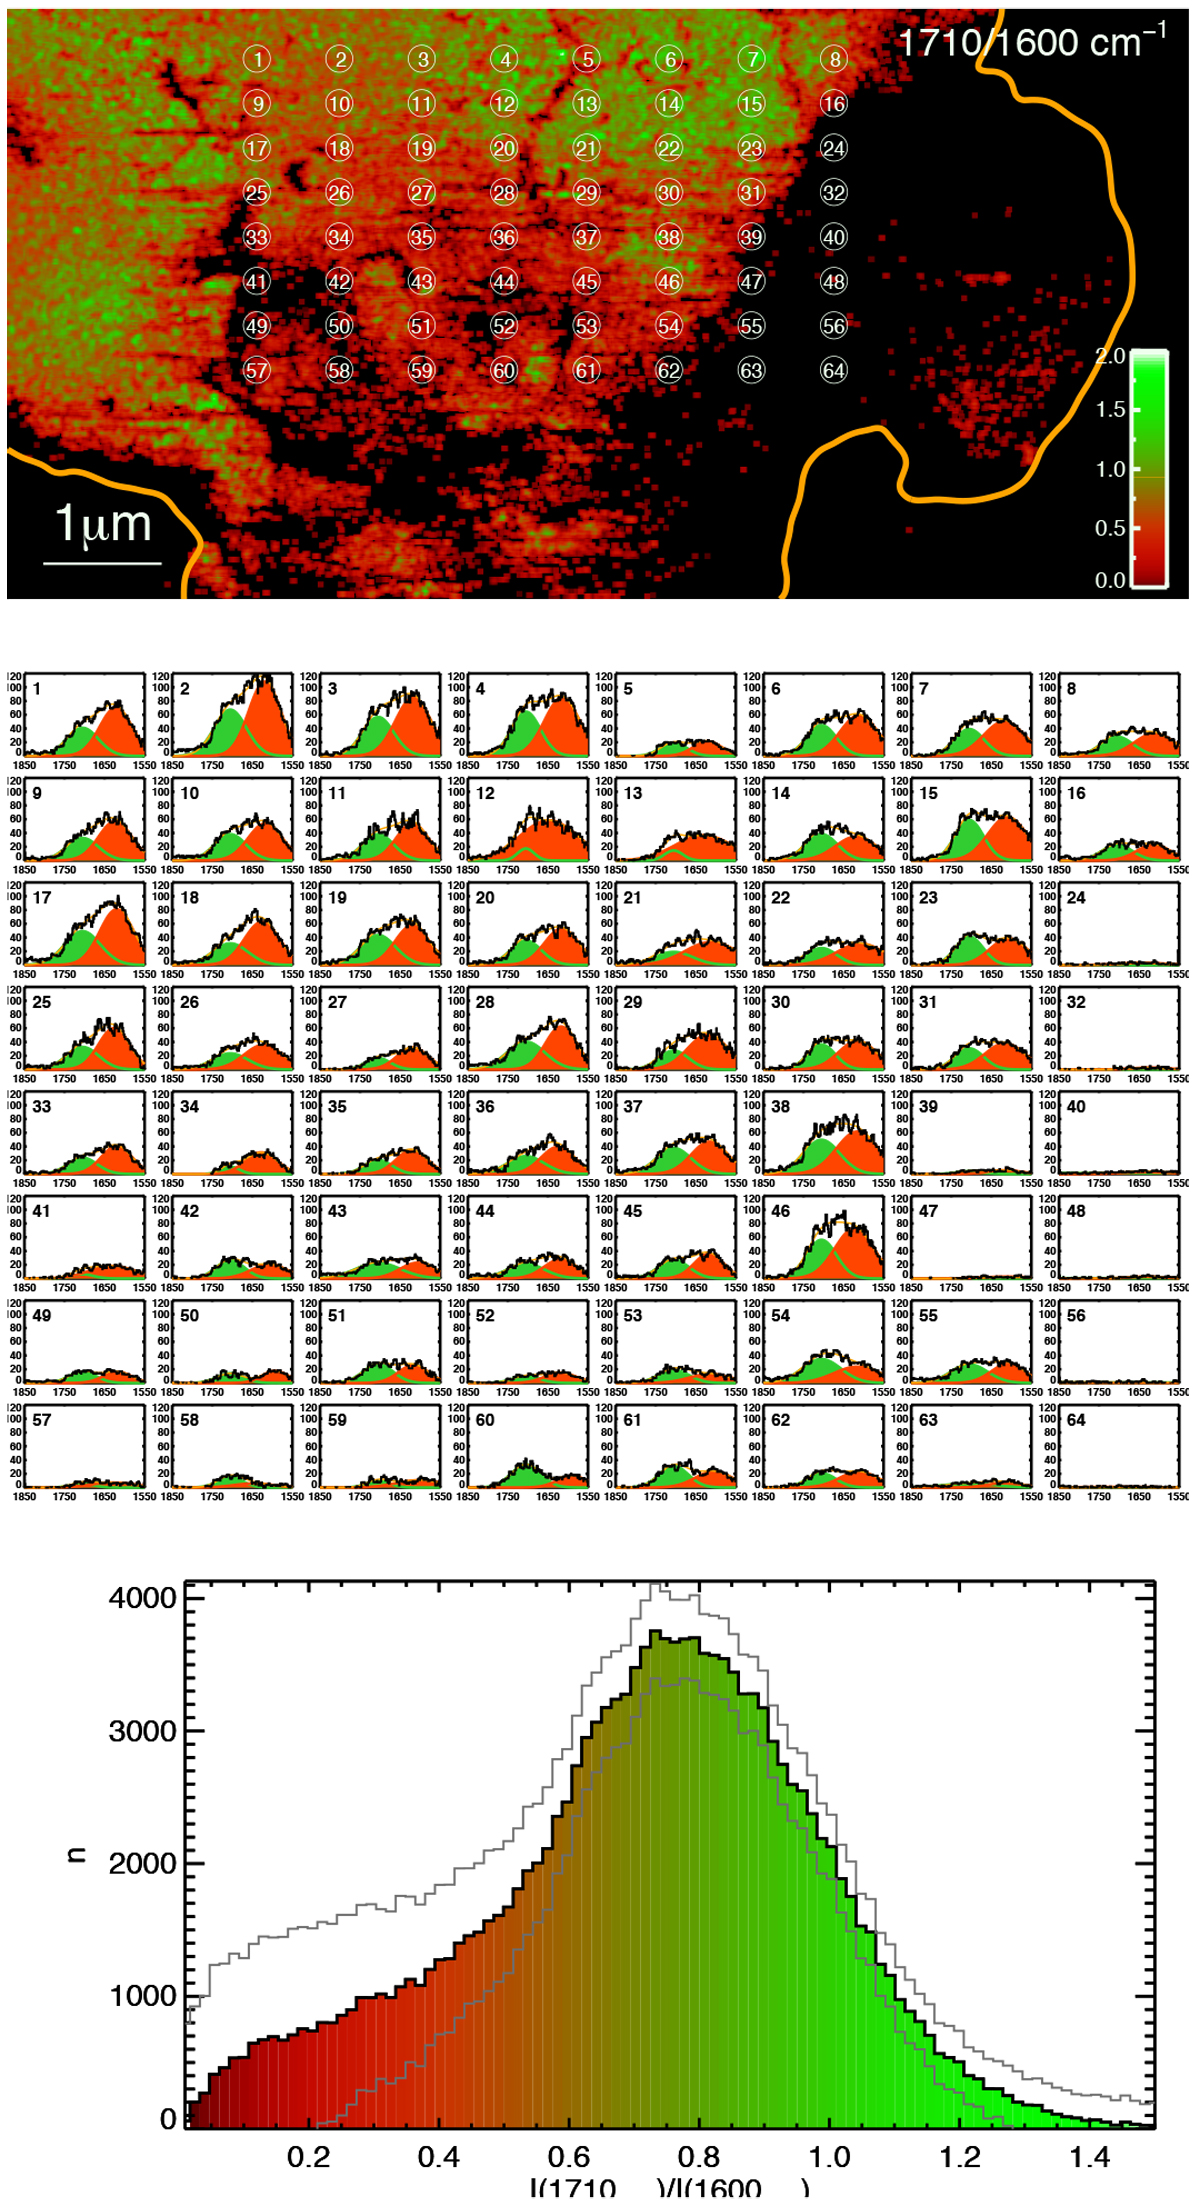
Top: DC06-07-18-b, ratio of the AFMIR maps at 1710 and 1600 cm−1 of the region of interest B. The orange contour delineates the AFM sample boundaries. Positionsfor the individual spectra presented in the middle panel recorded on a 8 × 8 equally sampled map are indicated on top of the ratio map. Middle: individual AFMIR spectra in the 1850–1550 cm−1 range recorded on an evenly spaced 8 × 8 map, with 0.7 μm spacing on the x-axis and 0.38 μm spacing on the y-axis. The spectra are deconvolved into two main bands corresponding to the carbonyl (C=O) dominating the 1710 cm−1, and contribution from the carbon backbone contributing to the 1600 cm−1 map. Bottom: histogram of the ratio of the AFMIR maps at 1710 and 1600 cm−1 of region of interest B.
Current usage metrics show cumulative count of Article Views (full-text article views including HTML views, PDF and ePub downloads, according to the available data) and Abstracts Views on Vision4Press platform.
Data correspond to usage on the plateform after 2015. The current usage metrics is available 48-96 hours after online publication and is updated daily on week days.
Initial download of the metrics may take a while.