Fig. 9.
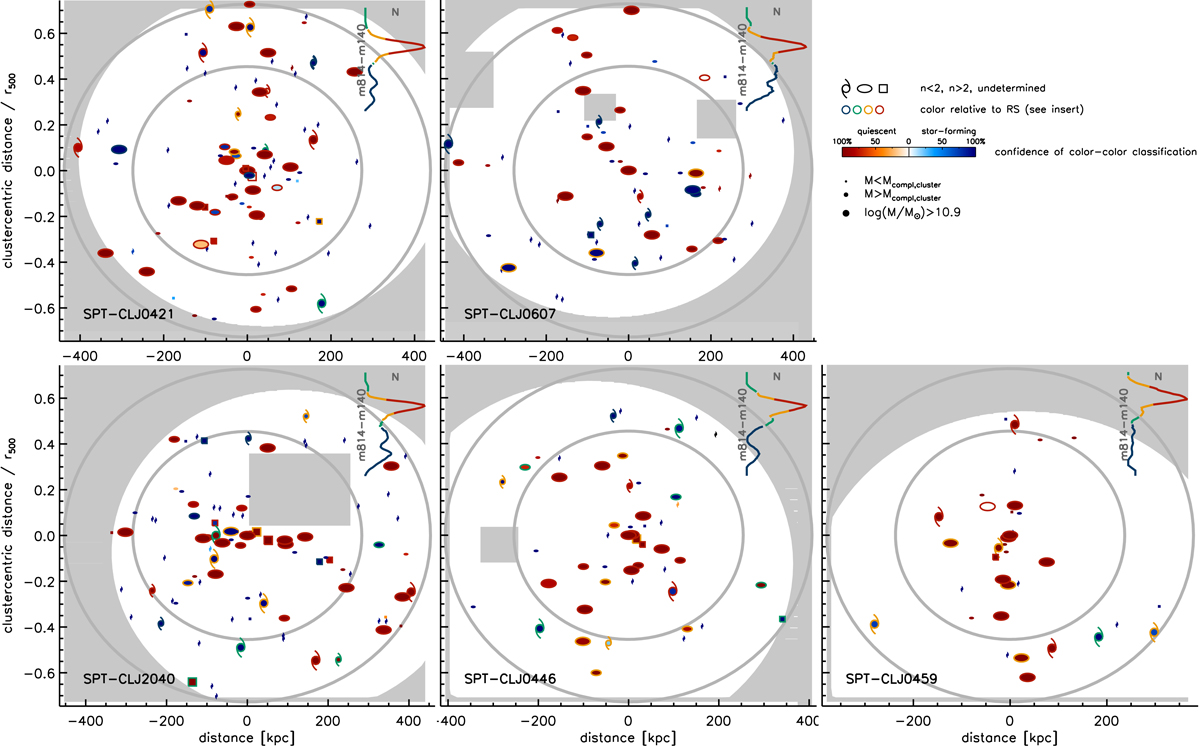
Projected distribution of candidate cluster members. All candidate members are shown regardless of their statistical background subtraction weight. Each symbol has two colors. The color of the symbol boundary scales with the m814–m140 color of each galaxy relative to the cluster RS color (see insert). The internal symbol color, in red or blue shade according to the galaxy classification as quiescent or starforming, scales with the reliability of this classification only accounting for the distance of the galaxy colors from the adopted selection dividing line and the relevant photometric errors. Symbol shape reflects the estimated Sersic index as indicated. Masked areas and regions deemed to be outside of our uniform coverage are gray shaded. The two circles show the limiting radii of the adopted cluster regions (r < 0.45r500, r < 0.7r500).
Current usage metrics show cumulative count of Article Views (full-text article views including HTML views, PDF and ePub downloads, according to the available data) and Abstracts Views on Vision4Press platform.
Data correspond to usage on the plateform after 2015. The current usage metrics is available 48-96 hours after online publication and is updated daily on week days.
Initial download of the metrics may take a while.