Fig. 7.
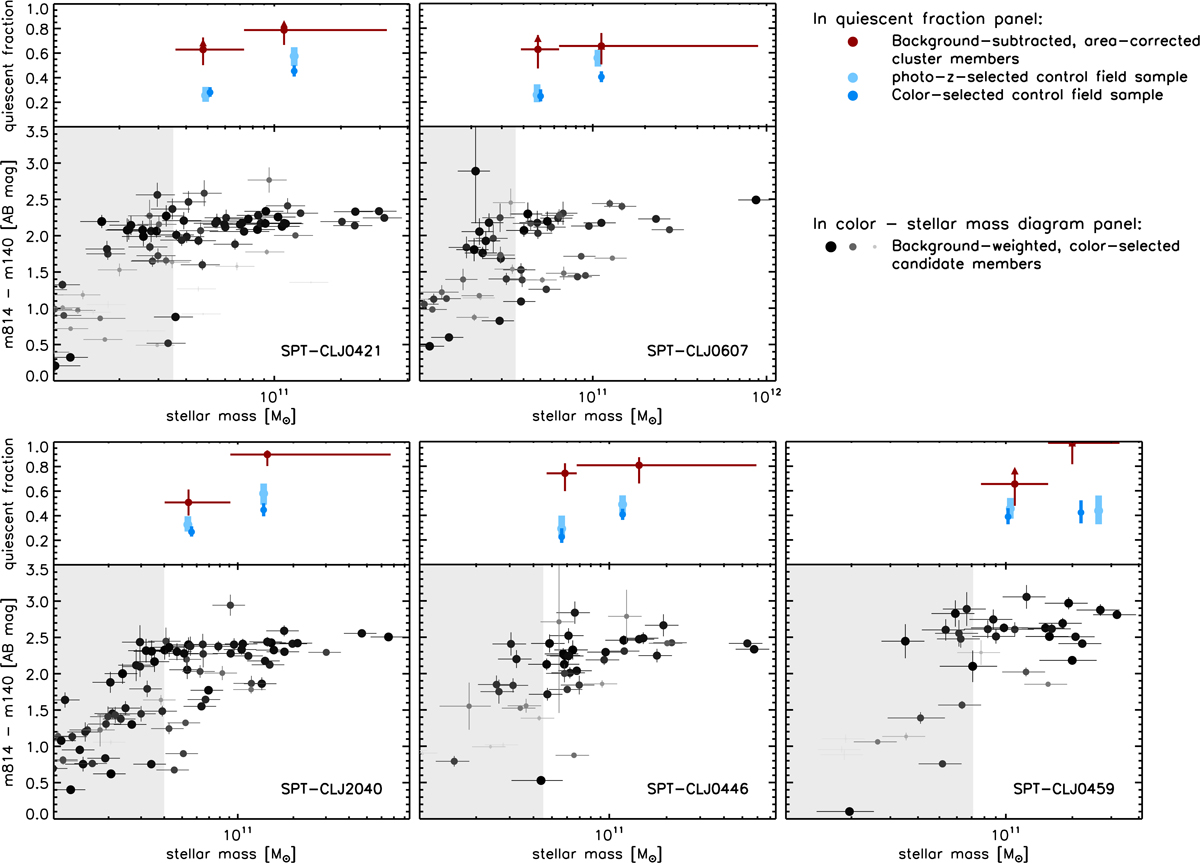
For each cluster: Bottom panel: m814–m140 color vs. stellar mass of candidate cluster members within r < 0.7r500. Symbol size and color reflect the statistical background subtraction weight as in Fig. 1. The light-gray shading shows the stellar mass range below the mass completeness limit. Top panel: quiescent fraction within r < 0.7r500 at masses above the individual mass completeness limit of the cluster (red symbols; error bars show the width of the stellar mass bin and the 1σ binomial confidence intervals, see Sect. 5.2). Where applicable, red triangles show quiescent fractions assuming that all unclassified galaxies are quiescent (rather than all star-forming, see Sect. 5.2). Blue symbols show the quiescent fraction in the same stellar mass bins for photo-z and color-selected field samples as in Fig. 1, as indicated. All symbols are plotted at the median mass of the given sample.
Current usage metrics show cumulative count of Article Views (full-text article views including HTML views, PDF and ePub downloads, according to the available data) and Abstracts Views on Vision4Press platform.
Data correspond to usage on the plateform after 2015. The current usage metrics is available 48-96 hours after online publication and is updated daily on week days.
Initial download of the metrics may take a while.