Fig. 6.
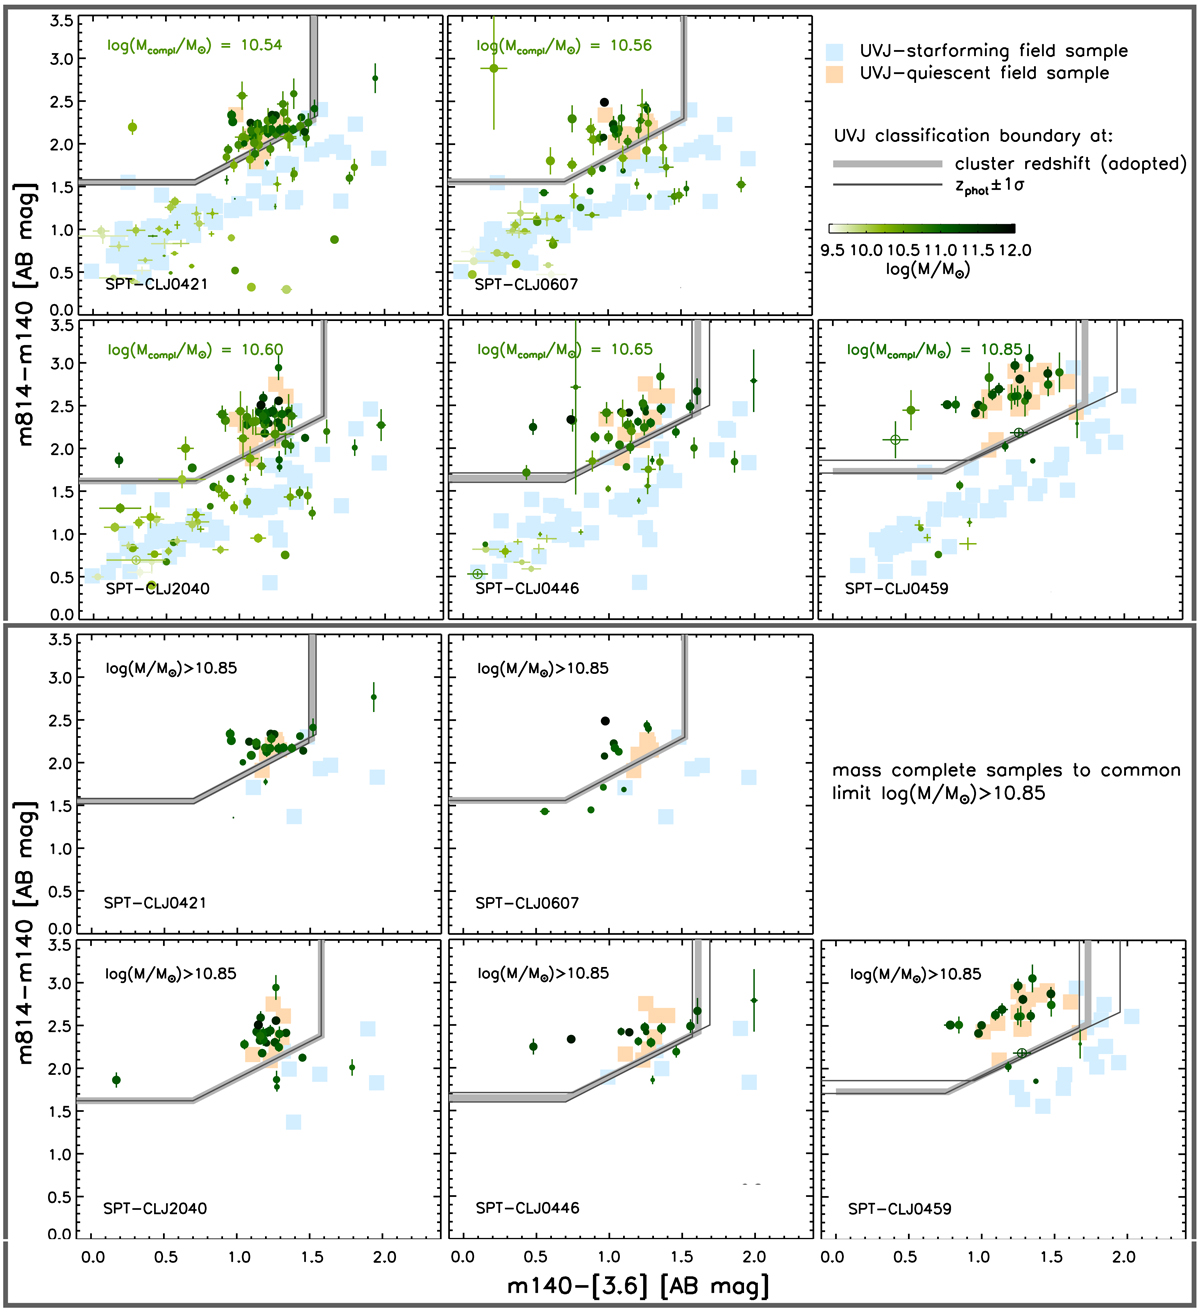
Adopted quiescent vs. star-forming galaxy classification. The observed m814–m140 vs. m140–[3.6] color–color diagram of candidate members (green points) is shown for all clusters in the r/r500 < 0.7 region (the effective area covered for each cluster is indicated). Upper set of panels: m140-selected (not mass complete) candidate member samples (the mass completeness limit for each cluster is indicated). Lower set of panels: galaxies down to the common stellar mass completeness limit for all clusters, log(M/M⊙) = 10.85. Symbol size of green points scales with the statistical background-subtraction weights as in Fig. 1. Symbol color scales with stellar mass as shown by the color bar. Empty symbols show points for which a m140–[3.6] color was inferred using the 4.5 μm flux (see Sect. 5.2). Light red and blue squares show, respectively, UVJ-quiescent and UVJ-starforming galaxies from the control field sample with the same magnitude (top panels) or mass (bottom panels) threshold as candidate cluster members, and with a photometric redshift within ±0.1 from the cluster redshift. The thick light-gray line shows the adopted quiescent vs. star-forming separation in the observed m814–m140 vs. m140–[3.6] color plane. For clusters without a final spectroscopic redshift confirmation (see Sect. 4), the thin dark-gray lines show the separation that would be adopted if assuming a redshift at the edges of the black+white error bars in Fig. 5 (top).
Current usage metrics show cumulative count of Article Views (full-text article views including HTML views, PDF and ePub downloads, according to the available data) and Abstracts Views on Vision4Press platform.
Data correspond to usage on the plateform after 2015. The current usage metrics is available 48-96 hours after online publication and is updated daily on week days.
Initial download of the metrics may take a while.