Fig. 5.
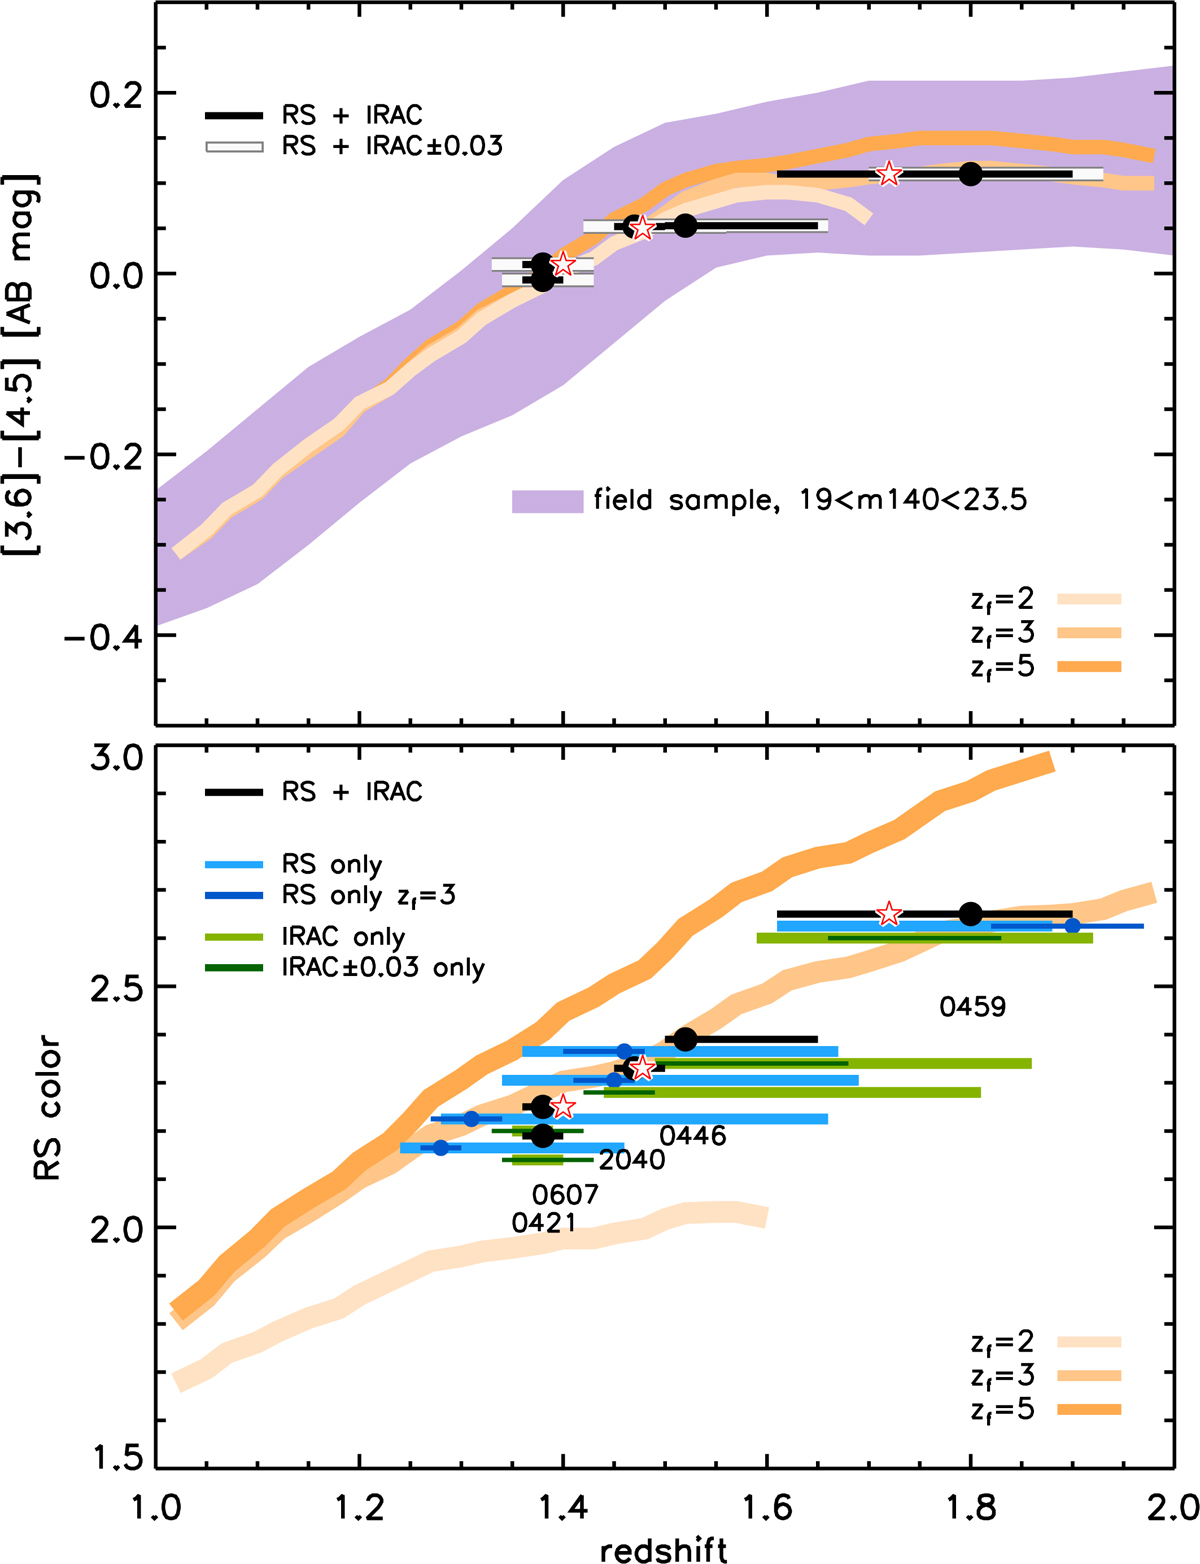
Photometric redshift constraints for all clusters (black points with 1σ errorbars reported in both panels) as determined with the simultaneous modeling of the red sequence (RS) and [3.6]–[4.5] color in Sect. 4. Red stars show the spectroscopic redshifts for SPT-CLJ2040 and SPT-CLJ0607, as well as the best current constraint for SPT-CLJ0459 (see Sect. 4). Bottom panel: adopted model RS m814–m140 color at M* vs. redshift, for formation redshifts 2 < zf < 5 (orange lines). Light blue bars show the 1σ constraints from modeling only the RS color (dark blue assuming zf = 3). Light green bars show constraints from the [3.6]–[4.5] color alone. Top panel: adopted model [3.6]–[4.5] color vs. redshift, for 2 < zf < 5 as in the bottom panel. The shaded area shows for reference the 16th–84th percentile range of [3.6]–[4.5] color vs. redshift for field galaxies in the magnitude range of our samples (m140 ≲ 23.5). Dark green (bottom panel) and white (top panel) bars show the impact on the best-fit redshift (from IRAC color alone and RS + IRAC color, respectively) of a ± 0.03 AB mag systematic offset on the [3.6]–[4.5] color.
Current usage metrics show cumulative count of Article Views (full-text article views including HTML views, PDF and ePub downloads, according to the available data) and Abstracts Views on Vision4Press platform.
Data correspond to usage on the plateform after 2015. The current usage metrics is available 48-96 hours after online publication and is updated daily on week days.
Initial download of the metrics may take a while.