Fig. 4.
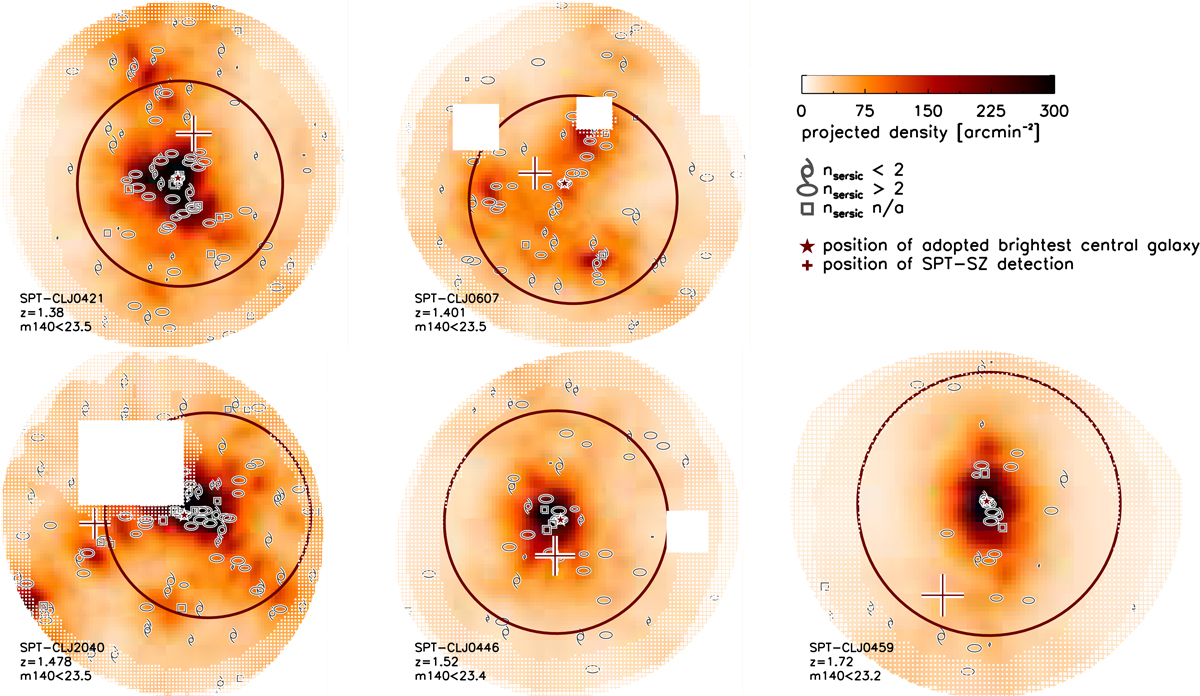
Projected density maps (see color bar) of candidate cluster members for the five clusters. Gray empty symbols show the position of individual candidate members, where symbol size scales with the galaxy statistical background subtraction weight (Sect. 3.2), and symbol shape reflects galaxy morphology. The cross marks the coordinates of the SPT-SZ detection, with the cross size showing the estimated positional uncertainty (1σ, see Sect. 3.4). The position of the adopted brightest central galaxy, defining the cluster center in the subsequent analysis, is indicated by a star. The circle is centered at the median coordinates of the 5% highest-density points in the map, and has a radius of 250 kpc at the cluster redshift (for comparison r500 ∼ 70″ ∼ 600 kpc for these clusters). Masked areas are blanked out and white gridding marks areas affected by edge effects.
Current usage metrics show cumulative count of Article Views (full-text article views including HTML views, PDF and ePub downloads, according to the available data) and Abstracts Views on Vision4Press platform.
Data correspond to usage on the plateform after 2015. The current usage metrics is available 48-96 hours after online publication and is updated daily on week days.
Initial download of the metrics may take a while.