Fig. 3.
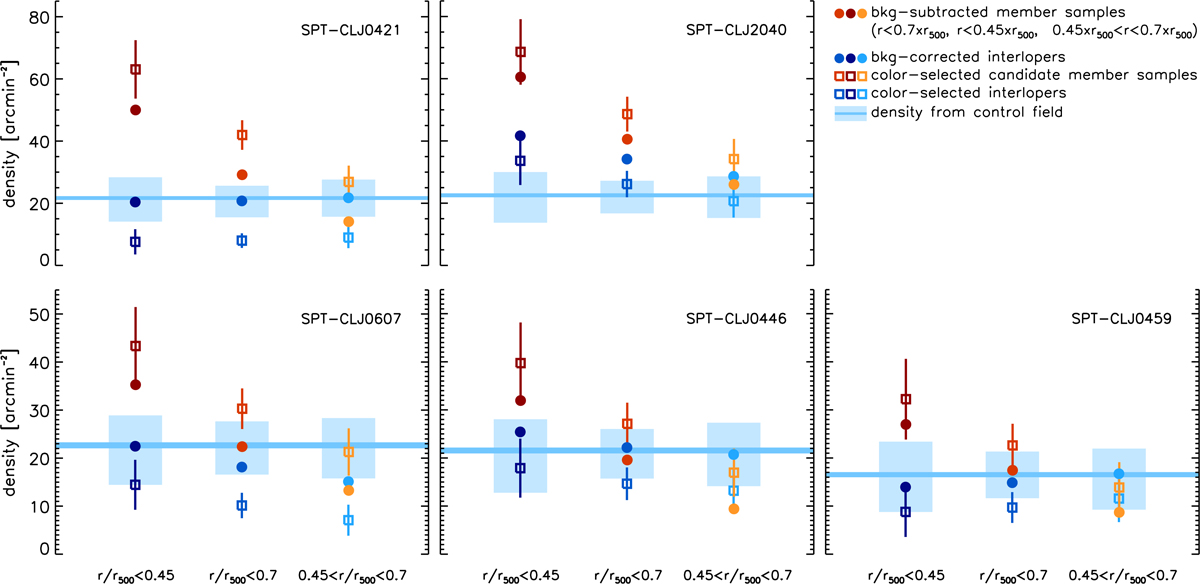
Projected number density of candidate cluster members (shades of red) and interlopers (blue) in the five clusters as measured in three cluster regions, as indicated. Empty squares show densities for color-selected samples (see Sect. 3.1), and filled circles show how member number density decreases – and interloper density increases – after applying the statistical subtraction of residual background contamination described in Sect. 3.2. The blue line shows the average density of control field galaxies in the same magnitude range adopted for the cluster, with the light-blue shaded areas showing the density variation (16th–84th percentiles) in apertures corresponding to the three probed regions. The relative flatness of the interloper density profiles constrains the cluster member sample incompleteness due to member misclassification (see Sect. 3.3).
Current usage metrics show cumulative count of Article Views (full-text article views including HTML views, PDF and ePub downloads, according to the available data) and Abstracts Views on Vision4Press platform.
Data correspond to usage on the plateform after 2015. The current usage metrics is available 48-96 hours after online publication and is updated daily on week days.
Initial download of the metrics may take a while.