Fig. 2.
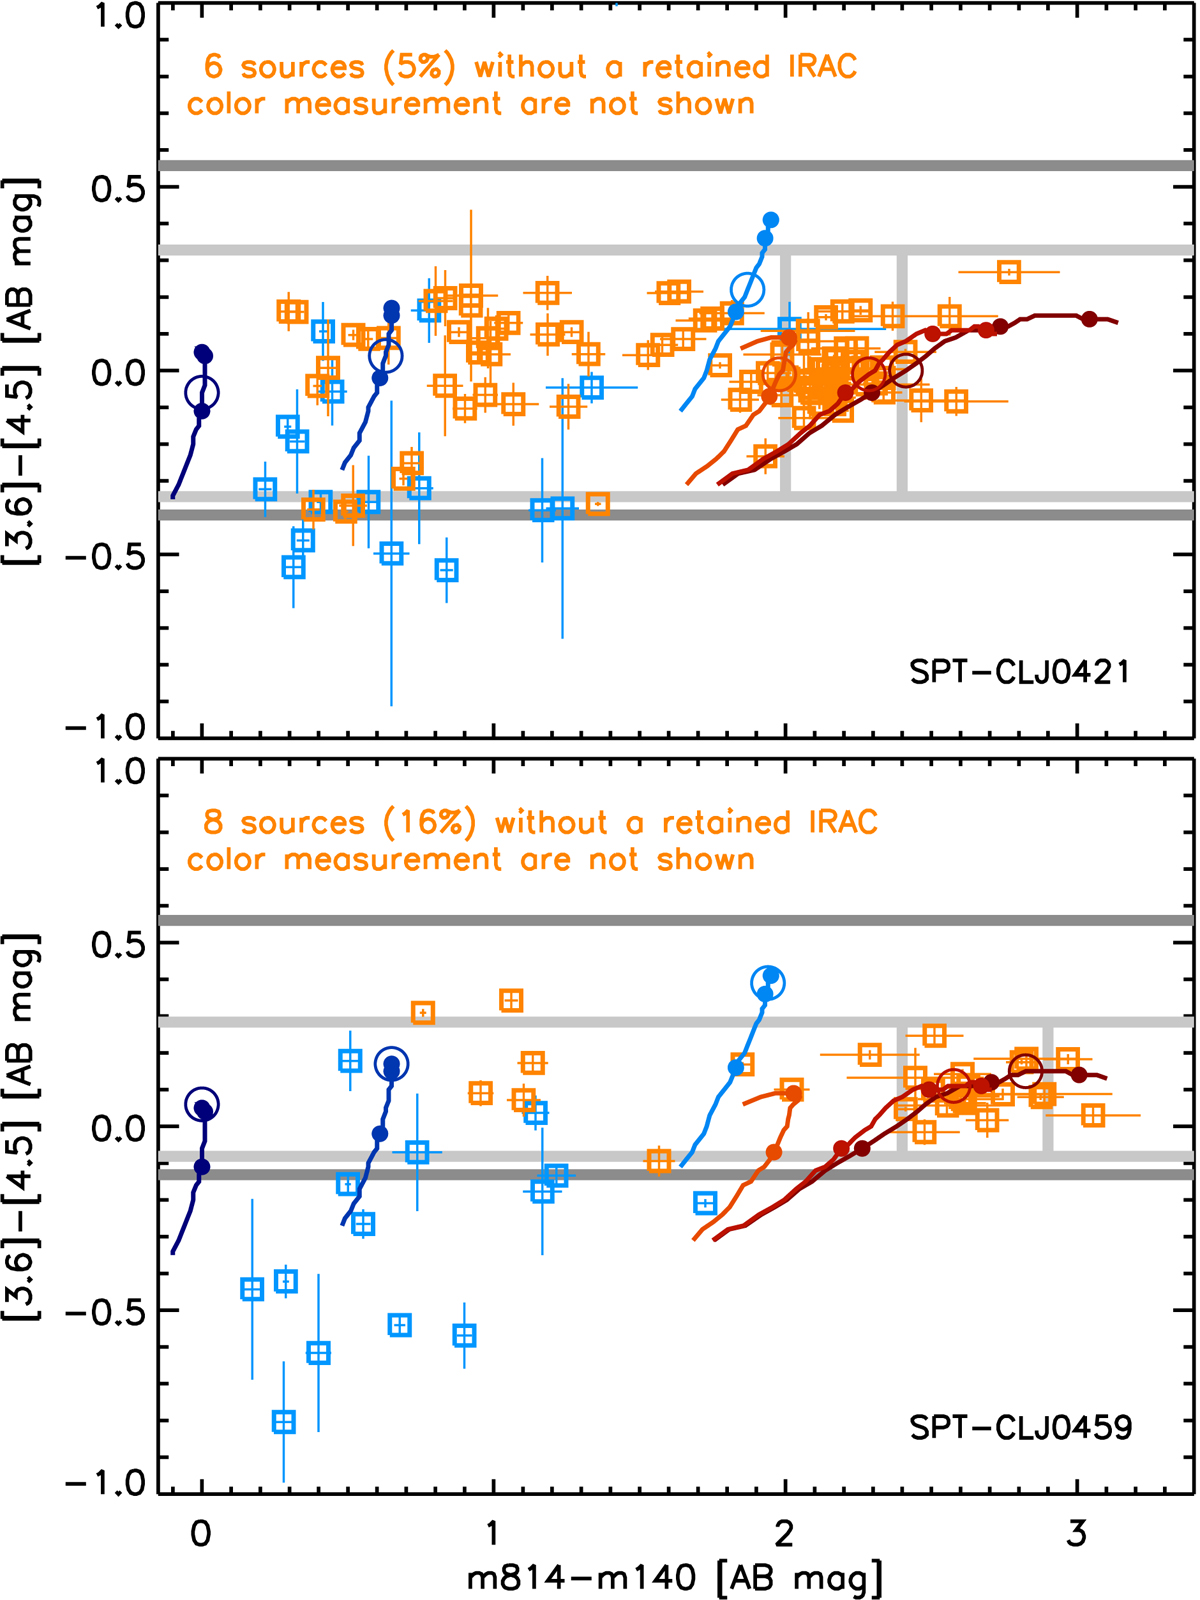
Two examples of the selection of candidate cluster members (see Sect. 3.1). Vertical gray lines bound the m814–m140 RS sample used for the initial definition of the IRAC color selection range, shown by the horizontal light-gray lines. Groups of red and blue tracks show, respectively, the colors as a function of redshift in the range 1 < z < 2 of quiescent (SSPs with zf = 2, 3, 5) and actively star-forming (100 Myr old constant star formation, Av = 0, 1, 3) stellar populations, used to obtain the final adopted IRAC color selection range (dark-gray lines, see Sect. 3.1 for full details). Small solid points along the tracks indicate z = 1.3, 1.6, 1.9; the large circle indicates the cluster redshift. Orange and blue squares mark the galaxies in the cluster field classified as candidate members or interlopers, respectively, with the full IRAC+HST color selection criteria described in Sect. 3.1.
Current usage metrics show cumulative count of Article Views (full-text article views including HTML views, PDF and ePub downloads, according to the available data) and Abstracts Views on Vision4Press platform.
Data correspond to usage on the plateform after 2015. The current usage metrics is available 48-96 hours after online publication and is updated daily on week days.
Initial download of the metrics may take a while.