Fig. C.3.
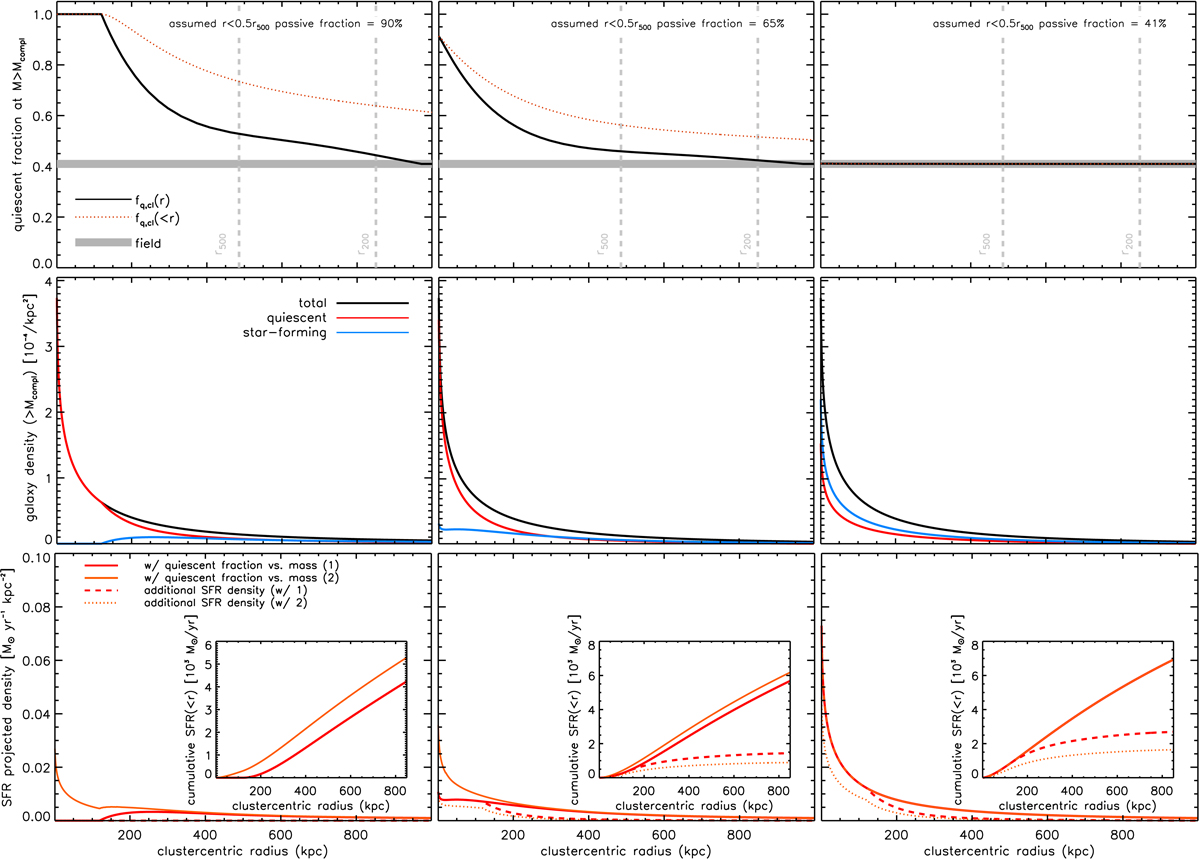
Example illustration of the modeling of the SFR density profiles described in Sect. 5.4, see text for full details. Left, middle and right panel: three different values assumed for the r < r500 quiescent fraction above mass completeness, as indicated. Top panels: radial profile of quiescent fraction above mass completeness (black, the field value is shown in gray). The dotted red line shows the quiescent fraction of the full mass complete sample out to the given clustercentric radius. Middle panels: projected galaxy number density profile above mass completeness (black), and the derived profiles of star-forming and quiescent galaxies (blue and red) given the quiescent fraction profile in the corresponding top panel. Bottom panels: corresponding projected SFR density profiles, derived with the two models of quiescent fraction vs. stellar mass as indicated (solid lines). Dashed and dotted lines show the additional SFR density profile over the prediction for the actually observed quiescent fraction (see text). Inserts show the corresponding cumulative SFR as a function of clustercentric radius.
Current usage metrics show cumulative count of Article Views (full-text article views including HTML views, PDF and ePub downloads, according to the available data) and Abstracts Views on Vision4Press platform.
Data correspond to usage on the plateform after 2015. The current usage metrics is available 48-96 hours after online publication and is updated daily on week days.
Initial download of the metrics may take a while.