Fig. C.2.
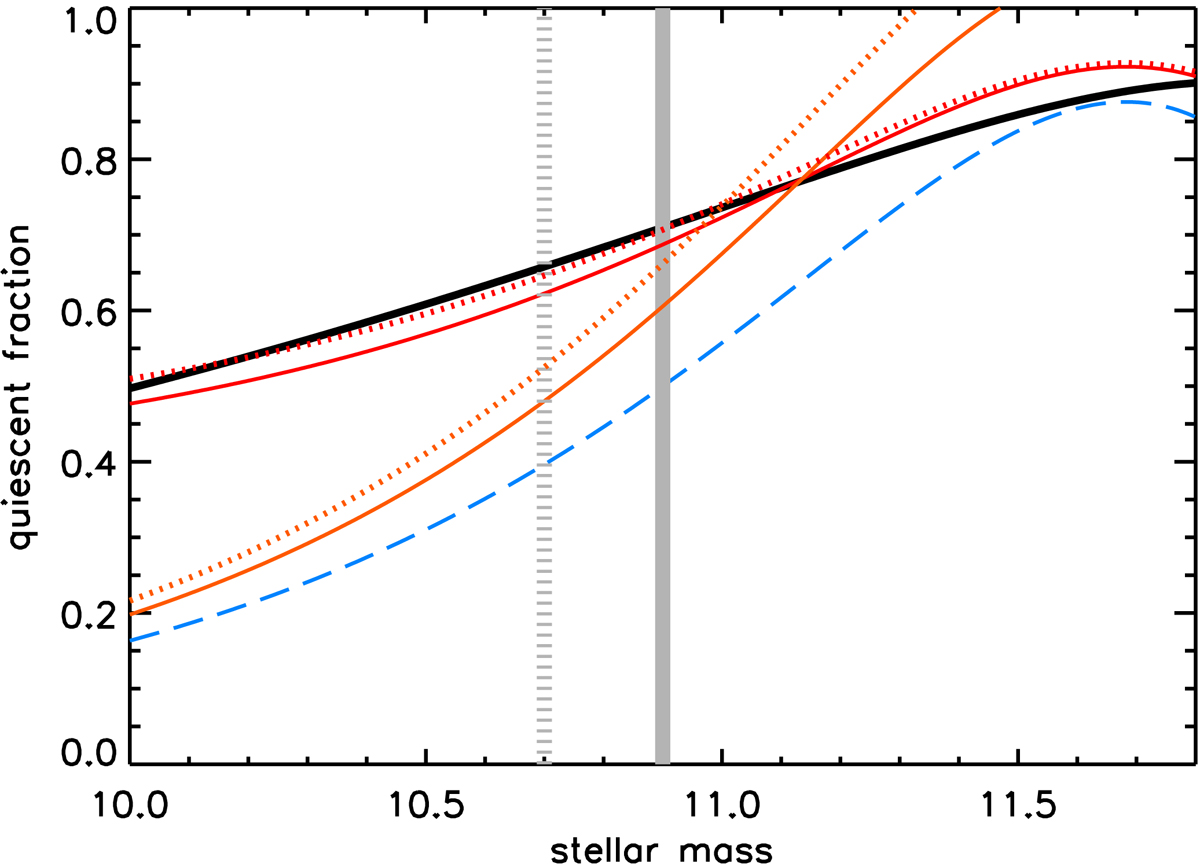
Test of the quiescent fraction vs. stellar mass modeling discussed in Sect. 5.4. The black line shows the observed quiescent fraction vs. stellar mass in z ∼ 1 clusters from van der Burg et al. (2013). The red and orange solid (dotted) lines (color coding as in Fig. C.1) show the estimated quiescent fraction vs. mass using the two approaches shown in Fig. C.1, starting from the observed quiescent fraction in a mass complete sample with log(M/M⊙) > 10.9 (10.7, respectively, as shown by vertical gray lines). Blue dashed line shows the field quiescent fractions vs. mass at the same redshift.
Current usage metrics show cumulative count of Article Views (full-text article views including HTML views, PDF and ePub downloads, according to the available data) and Abstracts Views on Vision4Press platform.
Data correspond to usage on the plateform after 2015. The current usage metrics is available 48-96 hours after online publication and is updated daily on week days.
Initial download of the metrics may take a while.