Fig. C.1.
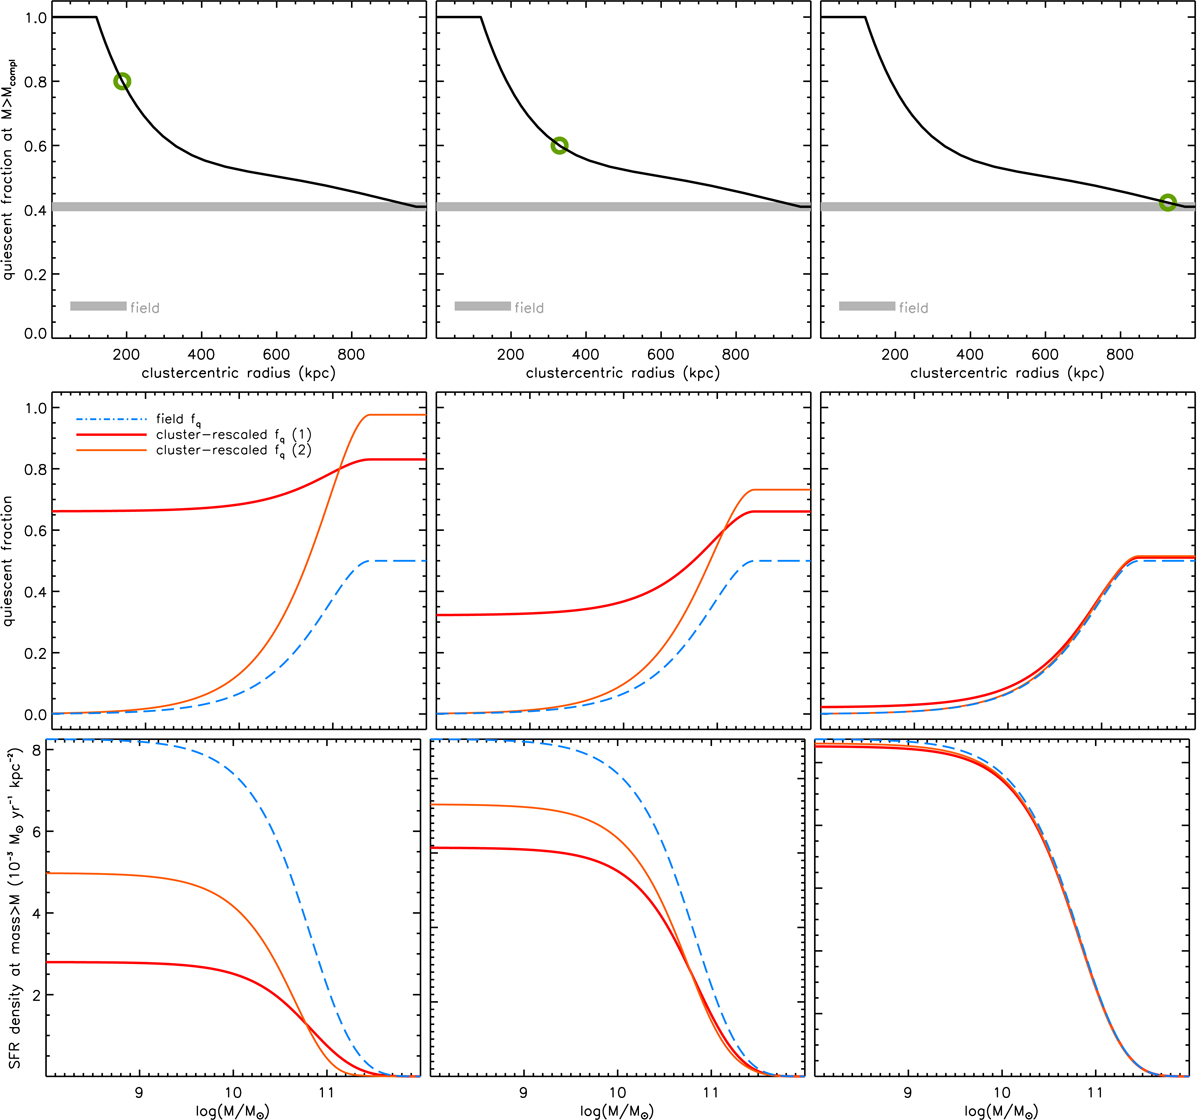
Example illustration of the modeling of the quiescent fraction vs. stellar mass. Top panels: assumed radial profile of the quiescent fraction above mass completeness. In the three panels a green circle highlights a given clustercentric distance, and thus quiescent fraction value. Based on these values, the corresponding middle panels show the quiescent fraction vs. stellar mass as estimated with both approaches described in Sect. 5.4 (red, orange lines). The blue line shows the quiescent fraction vs. mass in the field at the cluster redshift. The corresponding bottom panels show the overall contribution of galaxies above a given stellar masses to the total SFR density at the given clustercentric distance assuming the quiescent fraction vs. mass from the middle panels (see Sect. 5.4).
Current usage metrics show cumulative count of Article Views (full-text article views including HTML views, PDF and ePub downloads, according to the available data) and Abstracts Views on Vision4Press platform.
Data correspond to usage on the plateform after 2015. The current usage metrics is available 48-96 hours after online publication and is updated daily on week days.
Initial download of the metrics may take a while.