Fig. B.1.
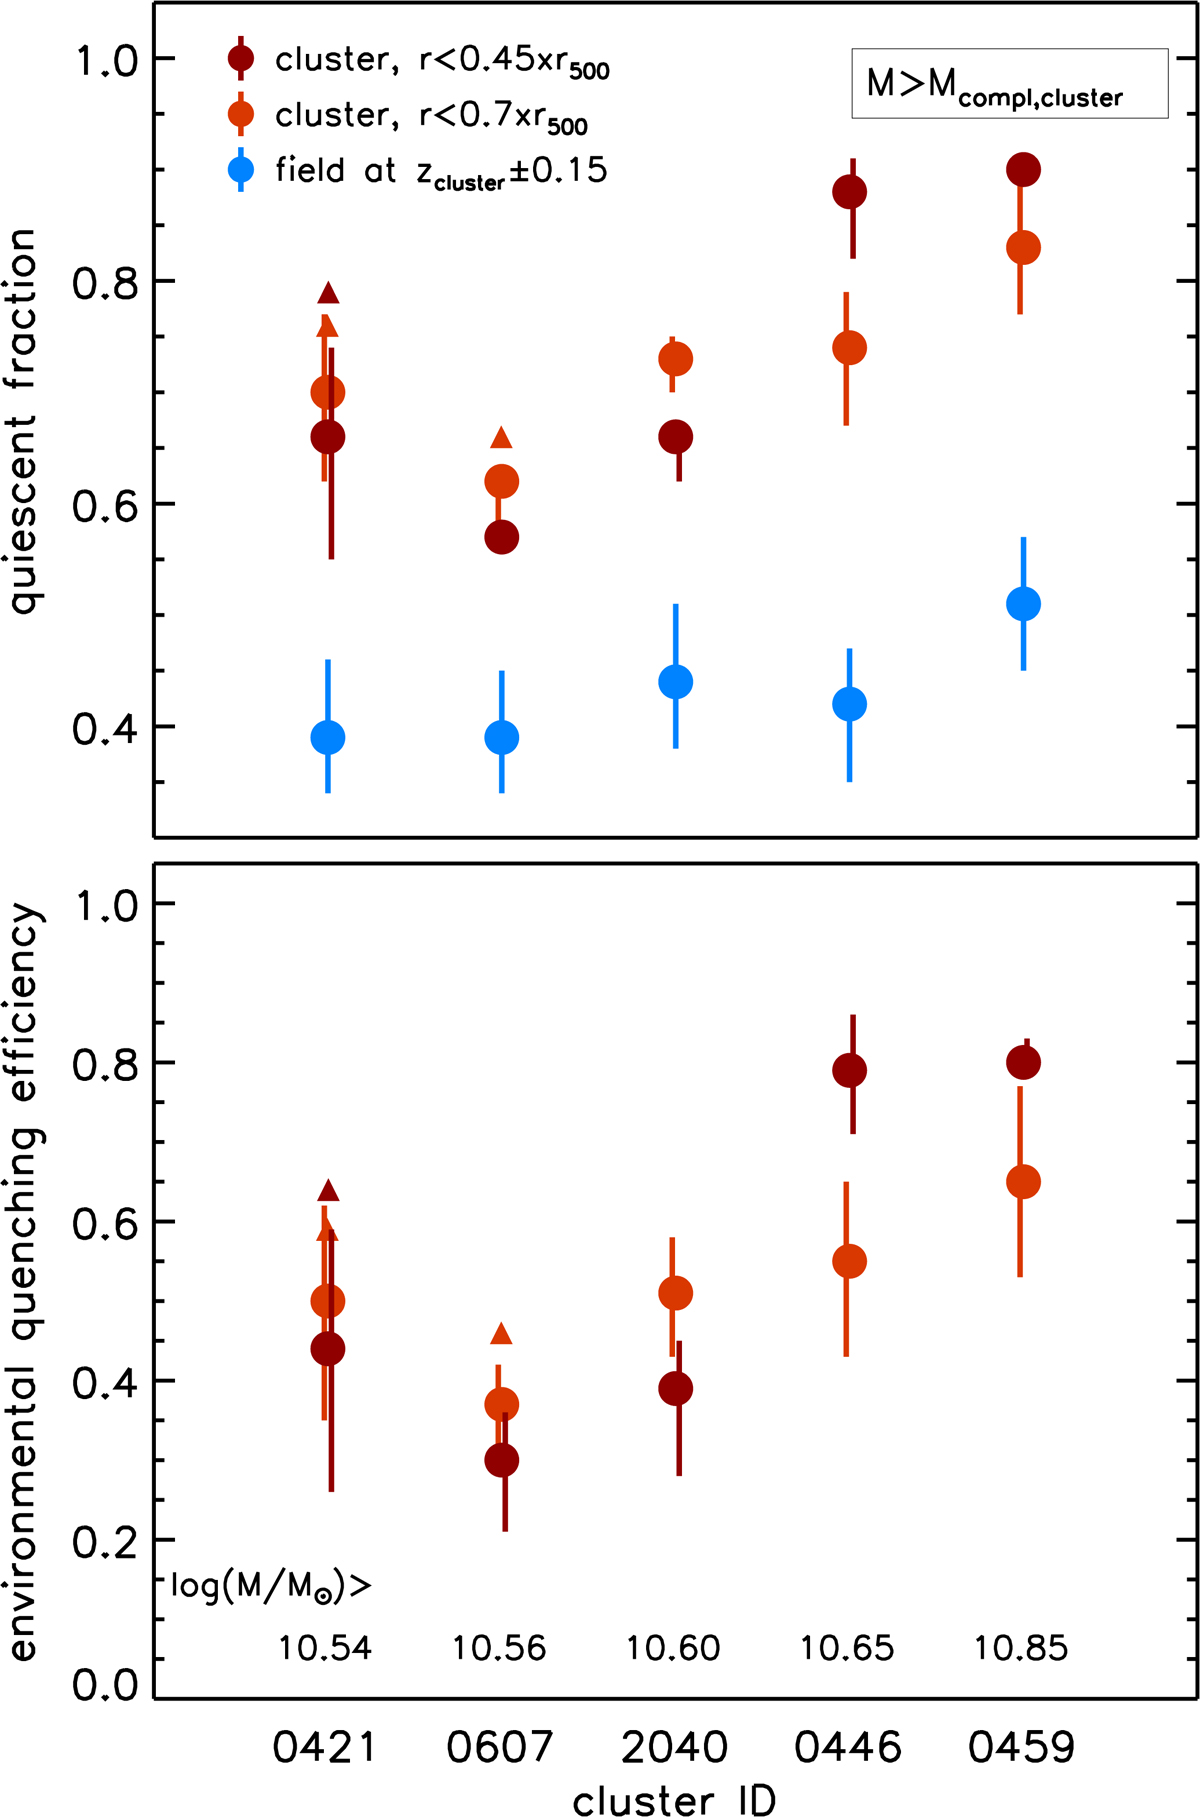
Top panel: quiescent fraction of cluster galaxies within r < 0.45r500 (dark red) and r < 0.7r500 (light red) above the mass completeness limit of each cluster as reported in the bottom panel. Error bars account for uncertainties in the quiescent vs. star-forming classification as described in Sect. 5.3. Blue symbols show the quiescent fraction in corresponding photo-z selected control field samples (see Sect. 5.3). Bottom panel: environmental quenching efficiency as derived from cluster and field quiescent fractions in the top panel. Color coding reflects the top panel. In both panels empty triangles show, where applicable, the quiescent fraction and derived quenching efficiency assuming that galaxies lacking a quiescent vs. star-forming classification are all quiescent (rather than all star-forming, see Sect. 5.2, Table 2).
Current usage metrics show cumulative count of Article Views (full-text article views including HTML views, PDF and ePub downloads, according to the available data) and Abstracts Views on Vision4Press platform.
Data correspond to usage on the plateform after 2015. The current usage metrics is available 48-96 hours after online publication and is updated daily on week days.
Initial download of the metrics may take a while.