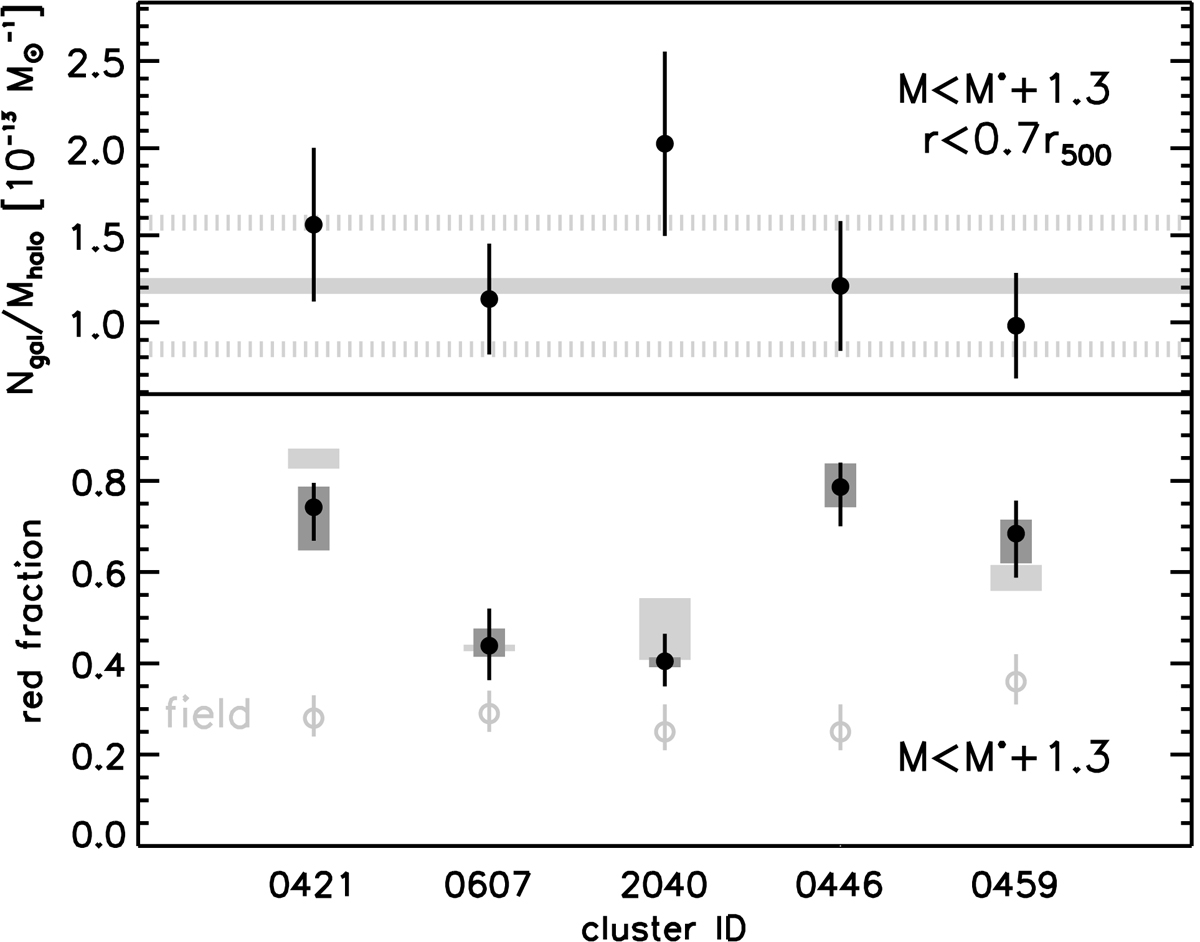
Fig. A.1.

Top panel: black points show for all clusters the estimated total number of background-subtracted cluster members at m140 < M* + 1.3 and within r < 0.7r500 divided by the total projected halo mass within the same region (Ngal/Mhalo). The solid gray line shows the median value for this cluster sample. The dashed lines show an estimate of the intrinsic scatter of Ngal/Mhalo. See text for details. Bottom panel: estimate of the effect of differences in the background density along the line of sight of the clusters on the estimated red fraction of cluster galaxies. Black points show the red fraction for all clusters as estimated adopting the default control field for the statistical residual background subtraction (Sect. 3.2). Dark gray bars show the effect on the estimated red fraction of adopting control sub-fields with densities in the 10th to 90th percentile range across the default control field. Light gray bars show the effect of considering the background-subtracted cluster member samples contaminated or incomplete according to the face-value Ngal/Mhalo of each cluster with respect to the median Ngal/Mhalo of the sample. See text for details. For comparison, light gray empty circles show the red fraction in field galaxies in the same m140 magnitude range, and with a photo-z within ±0.15 of the cluster redshift.
Current usage metrics show cumulative count of Article Views (full-text article views including HTML views, PDF and ePub downloads, according to the available data) and Abstracts Views on Vision4Press platform.
Data correspond to usage on the plateform after 2015. The current usage metrics is available 48-96 hours after online publication and is updated daily on week days.
Initial download of the metrics may take a while.


