Fig. 11.
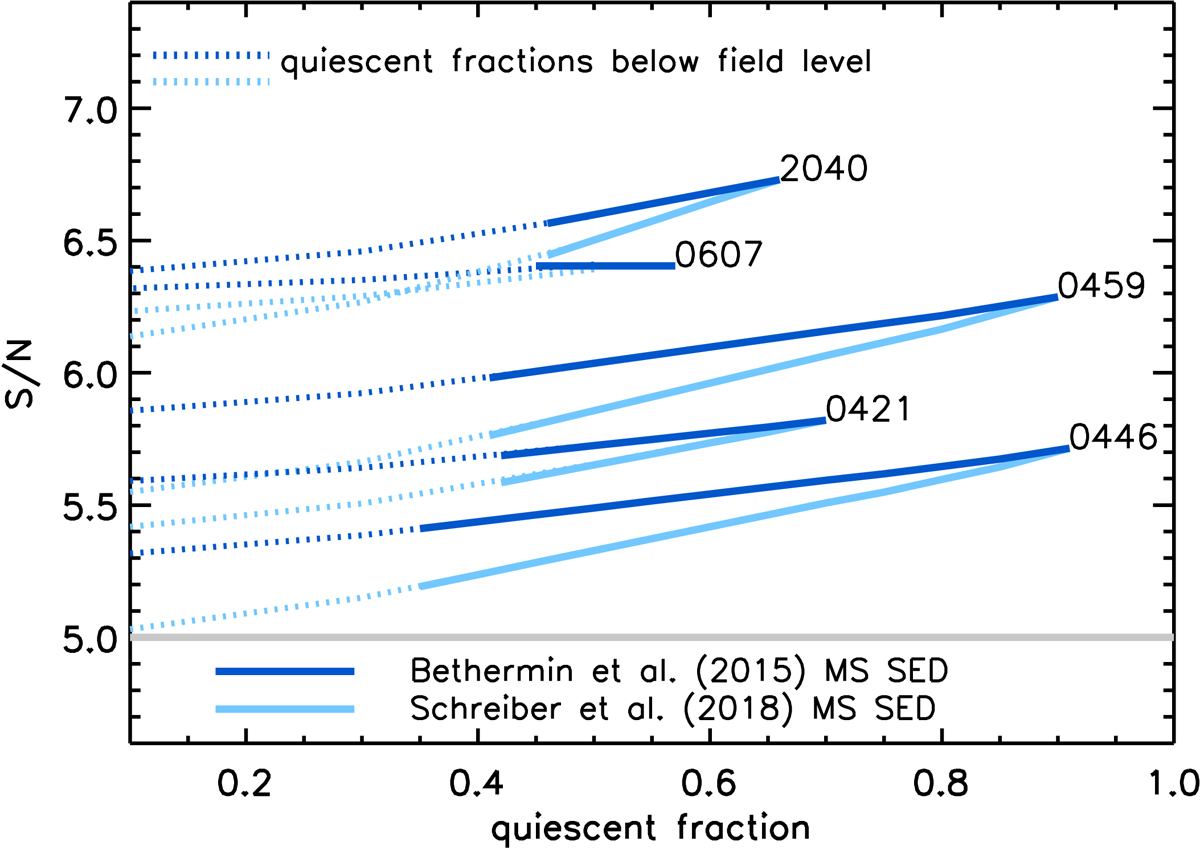
Retrieved S/N of the cluster SZE detection obtained as a function of the r < 0.45r500 quiescent fraction, from the observed value down to the field level (solid lines) at the cluster redshift and mass completeness limit (see Sect. 5.4). Dotted lines show for completeness the retrieved S/N for central quiescent fractions down to 10%. For each cluster, the S/N is shown for both MS SEDs adopted to convert SFRs to 95, 150 GHz fluxes, as indicated. The gray line marks the S/N > 5 limit of our original sample selection. According to the modeling in Sect. 5.4, all five clusters would have been included in our S/N > 5 sample even if environmental quenching were negligible.
Current usage metrics show cumulative count of Article Views (full-text article views including HTML views, PDF and ePub downloads, according to the available data) and Abstracts Views on Vision4Press platform.
Data correspond to usage on the plateform after 2015. The current usage metrics is available 48-96 hours after online publication and is updated daily on week days.
Initial download of the metrics may take a while.