Fig. 1.
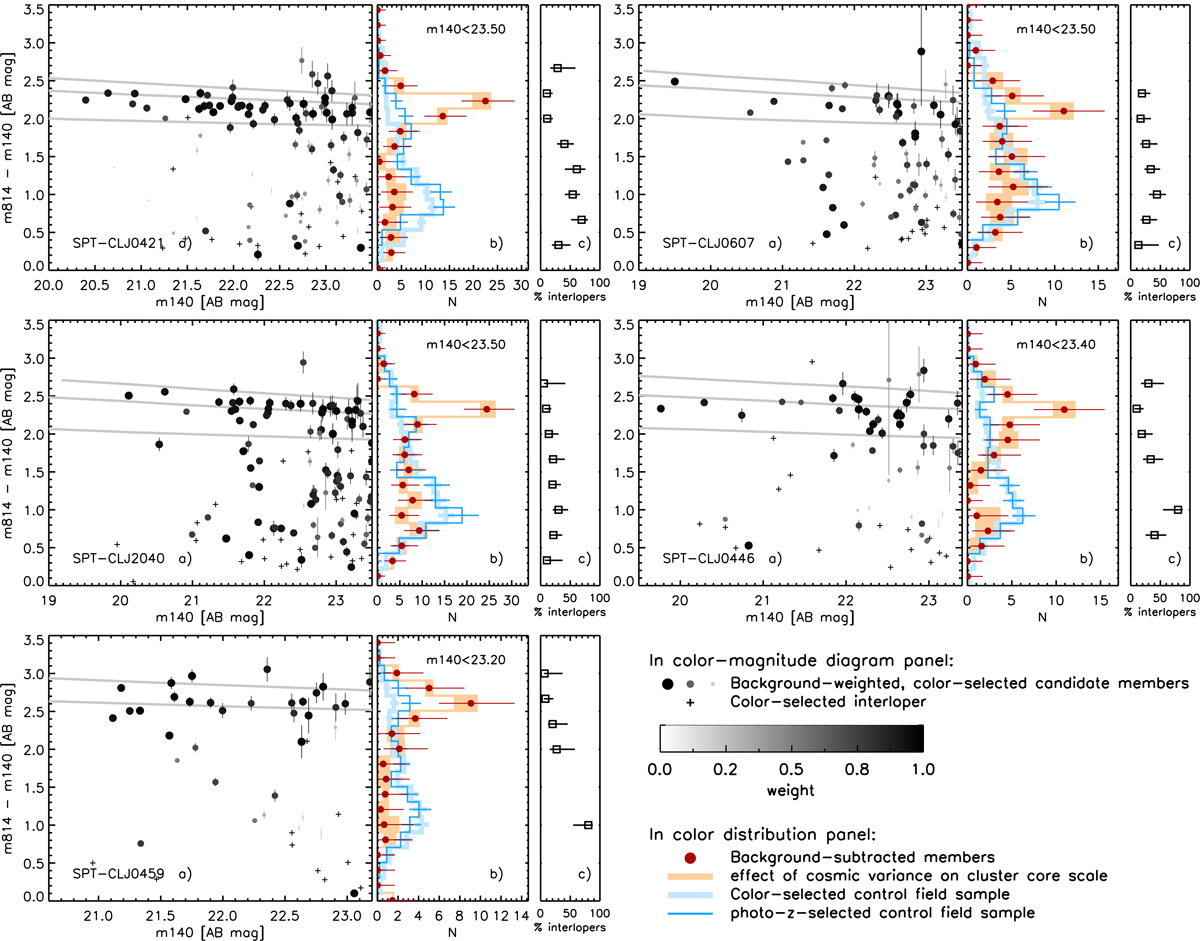
Color-magnitude diagrams and derived properties within the r < 0.7r500 region of each cluster are shown in subfigures, each with three panels. Panel a: visualization of the background-subtracted color-magnitude diagram, where size and color of each galaxy point scale according to its statistical background subtraction weight (see color bar in legend) determined in Sect. 3.2. All galaxies are shown, but color-rejected interlopers (see Sect. 3.1) are shown as crosses. Gray lines show Kodama & Arimoto (1997) red-sequence (RS) models with formation redshifts zf = 2, 3, 5. The color range is the same for all clusters to facilitate direct comparison of RS colors. Panel b: color distribution of background-subtracted and area-corrected cluster members (red points with error bars) down to the indicated m140 limit. The orange shaded area shows an estimate of the impact of cosmic variance on the scale of the cluster core field, as detailed in Sect. 5.1. The blue histograms show the color distribution (rescaled by total number of galaxies) in the control-field sample, using the same color selection as for cluster candidate members (light blue), or a photometric redshift selection within ±0.2 of the cluster redshift (darker blue). All clusters show a clear excess of red galaxies with respect to the field distribution. Panel c: estimated fraction of interlopers in the color-selected candidate member sample as a function of color (down to the indicated m140 limit), based on the weights in panel a. Contamination is low for RS galaxies but significant for blue galaxies. Error bars show binomial confidence intervals (1σ) computed following Cameron et al. (2011).
Current usage metrics show cumulative count of Article Views (full-text article views including HTML views, PDF and ePub downloads, according to the available data) and Abstracts Views on Vision4Press platform.
Data correspond to usage on the plateform after 2015. The current usage metrics is available 48-96 hours after online publication and is updated daily on week days.
Initial download of the metrics may take a while.